Latest data shows that so far in the year 2022, the rest of the crypto market has been moving in tandem with Bitcoin.
Crypto Indexes Follow Bitcoin In January So Far
As per the latest weekly report from Arcane Research, all the various indexes in the crypto market have mimicked BTC’s movements so far in the month of January.
The “crypto indexes” here refer to groups of cryptocurrencies separated into these divisions on the basis of market cap.
There are three main indexes, the “large cap index,” the “mid cap index,” and the “small cap index.” The below chart shows how these various groups have performed compared to Bitcoin in the year 2022 so far:
Looks like monthly performance of the mid cap index has been the best so far | Source: The Arcane Research Weekly Update - Week 2
As you can see in the above graph, the various crypto indexes seem to be moving in tandem with Bitcoin in the year so far.
Related Reading | 70% Of Bitcoin Supply Is In Profit – Why Bulls Need To Defend This Level
BTC’s returns in January stand at double digits in the red at the moment, closely followed by the small cap index which also has 10% in losses.
The large cap has also traced Bitcoin quite closely as its losses stand at 8% right now. The reason for its slight overperformance against BTC has been due to the strength of DOGE, NEAR, and ADA.
While the mid cap index has also mimicked the moves made by BTC, its strength has been much more as its returns for the month are at just 2% in the red.
Related Reading | Bitcoin Supply Shock: Only 12% Of BTC Supply Is On Exchanges Now
The mid cap index has outperformed the rest of the market thanks to the strength of UNI and MATIC, two cryptos that account for about 20% of the total index.
Bitcoin’s dominance has once again dropped in the last week as its share of the total crypto market cap now floats below 40%.
The below table shows the percentage of the total market cap that the top coins occupy right now.
BTC's share of the market cap has taken a hit of 0.76% over the past week | Source: The Arcane Research Weekly Update - Week 2
Ethereum’s dominance has also dropped in the past week, while smaller altcoins have enjoyed a larger percentage of the market cap.
BTC Price
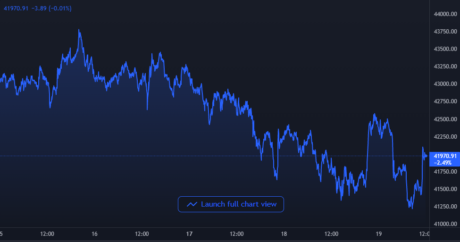
At the time of writing, Bitcoin’s price floats around $41.9k, down 2% in the last seven days. Over the past month, the crypto has dropped 10% in value.
The below chart shows the trend in the price of BTC over the last five days.
BTC's price has mostly moved sideways in the last few days | Source: BTCUSD on TradingView
Featured image from Unsplash.com, charts from TradingView.com, Arcane Research


