
Ethereum’s native token, Ether (ETH), has fallen 5.73% from its weekend high near $4,766, retreating as traders trim risk ahead of Wednesday’s Federal Reserve interest rate decision.
The pullback reflects caution in the market, but the bigger question is whether the Fed’s potential dovish shift could reignite Ethereum’s rally and how far the next move might extend.
ETH price can rally 45% in a breakout scenario
Ether bulls are defending the 20-day exponential moving average (20-day EMA; the green wave) near $4,450, showing resilience as markets price in a 96.1% chance of a Fed rate cut this week, up from 85.4% a month ago, with two more reductions expected by year’s end.
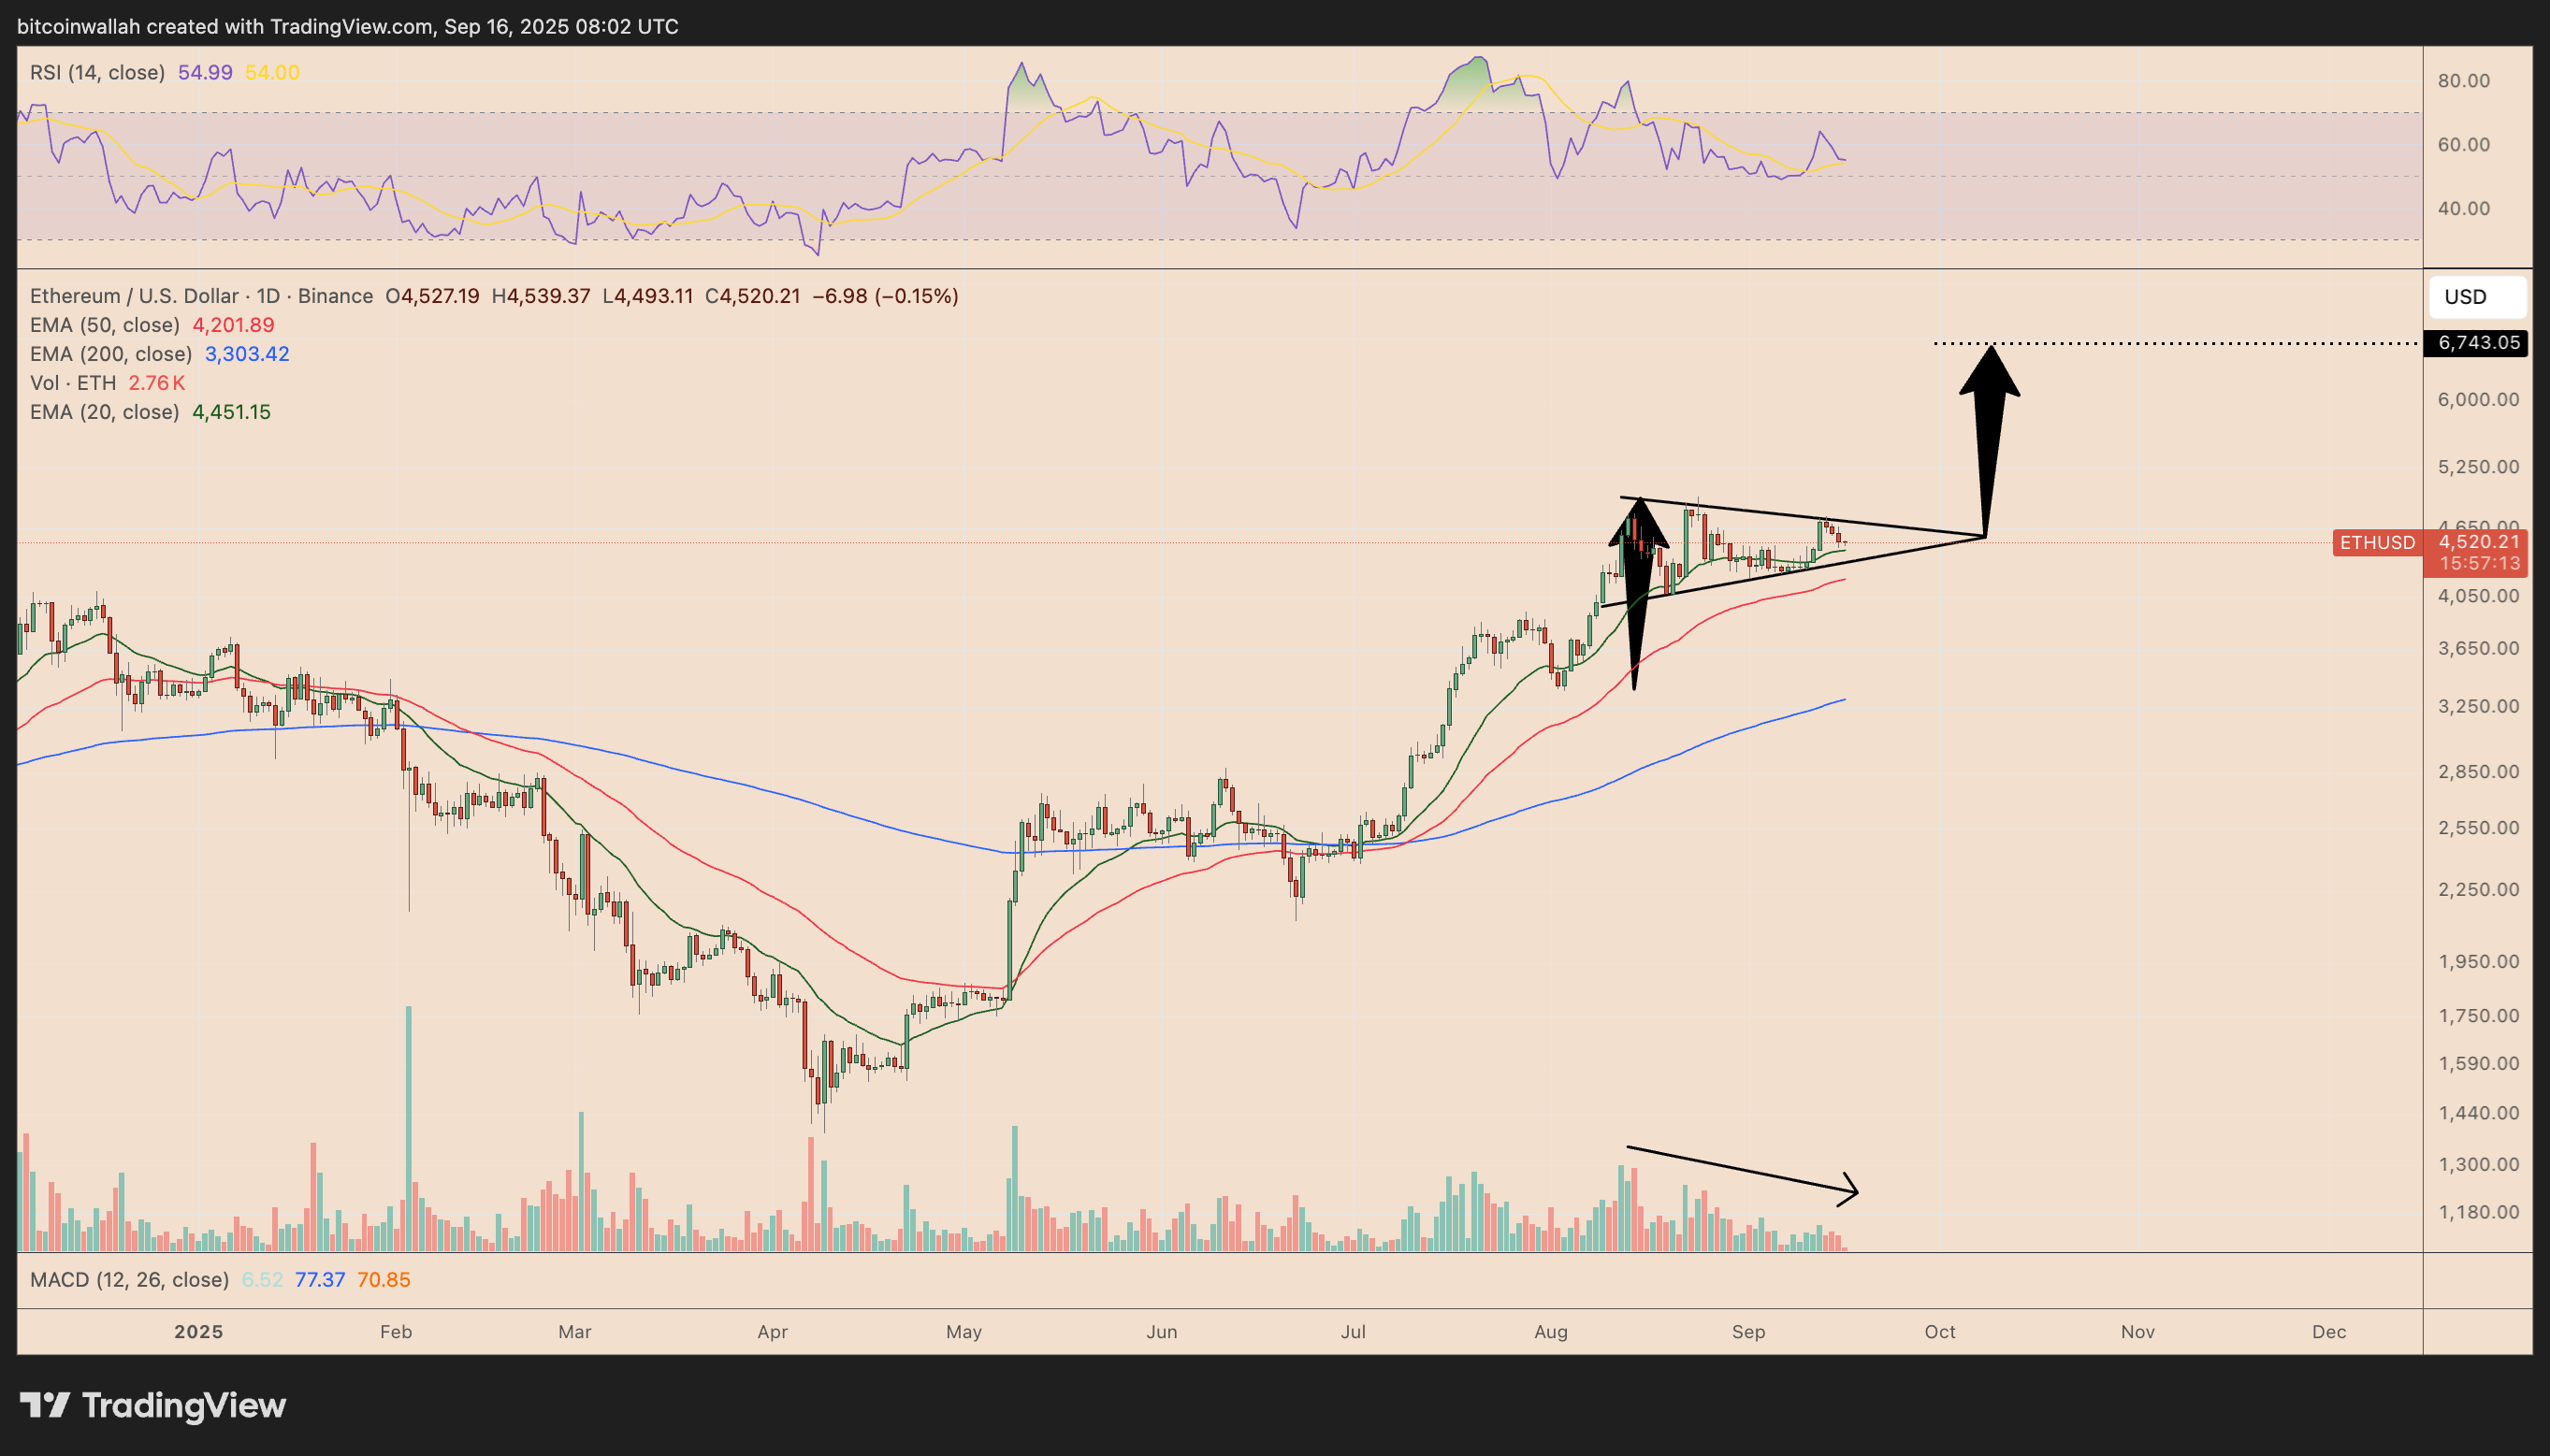
The consolidation has become a bull pennant, a continuation pattern typically preceding another leg higher. Volumes have steadily declined during this formation, a hallmark sign of a maturing pennant setup.
Related: Bitcoin, Ether could make ‘monster move’ in next 3 months: Tom Lee
The chart pattern projects a move toward $6,750 by October, more than 45% above current levels, if ETH closes decisively above the pennant’s upper trendline.
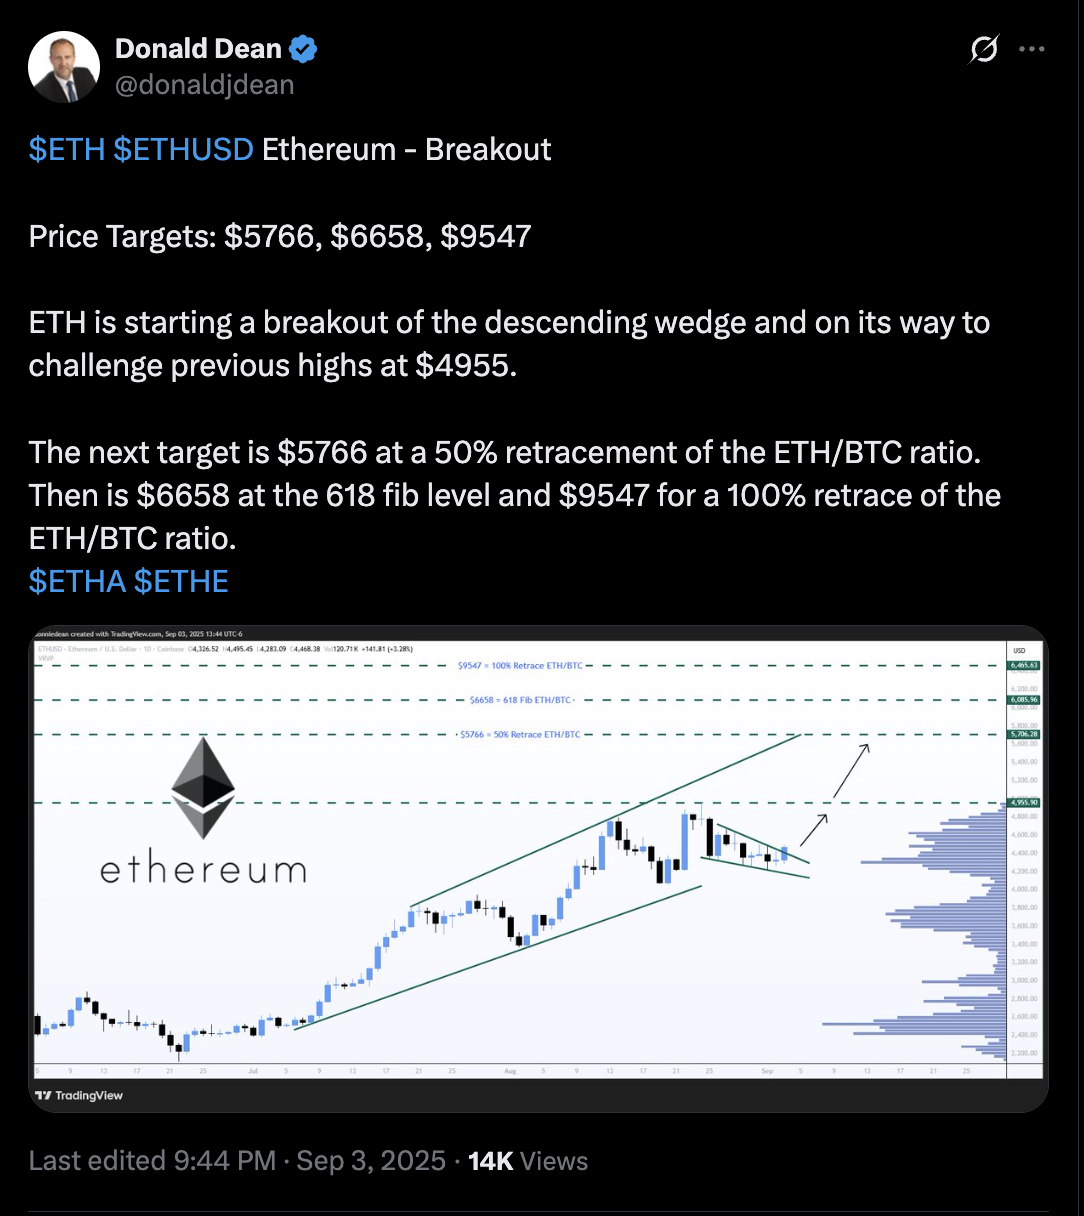
This ETH upside target resembles the ones put forth by Tesseract CEO James Harris and analyst Donald Dean recently.
ETH dips are for buying: Analysts
A failure to defend the 20-day EMA could open the door to a further decline toward the area defined by the triangle’s lower trendline (~$4,350) and the 50-day EMA (the red wave) near $4,200.
But to many analysts, these declines will likely lead to more dip-buying, leading the ETH price higher.
That includes chartist Ash Crypto, who suggest that dropping below the pennant’s lower trendline wouldn’t invalidate the upside setup but instead send prices rallying over $5,000 in the coming weeks.
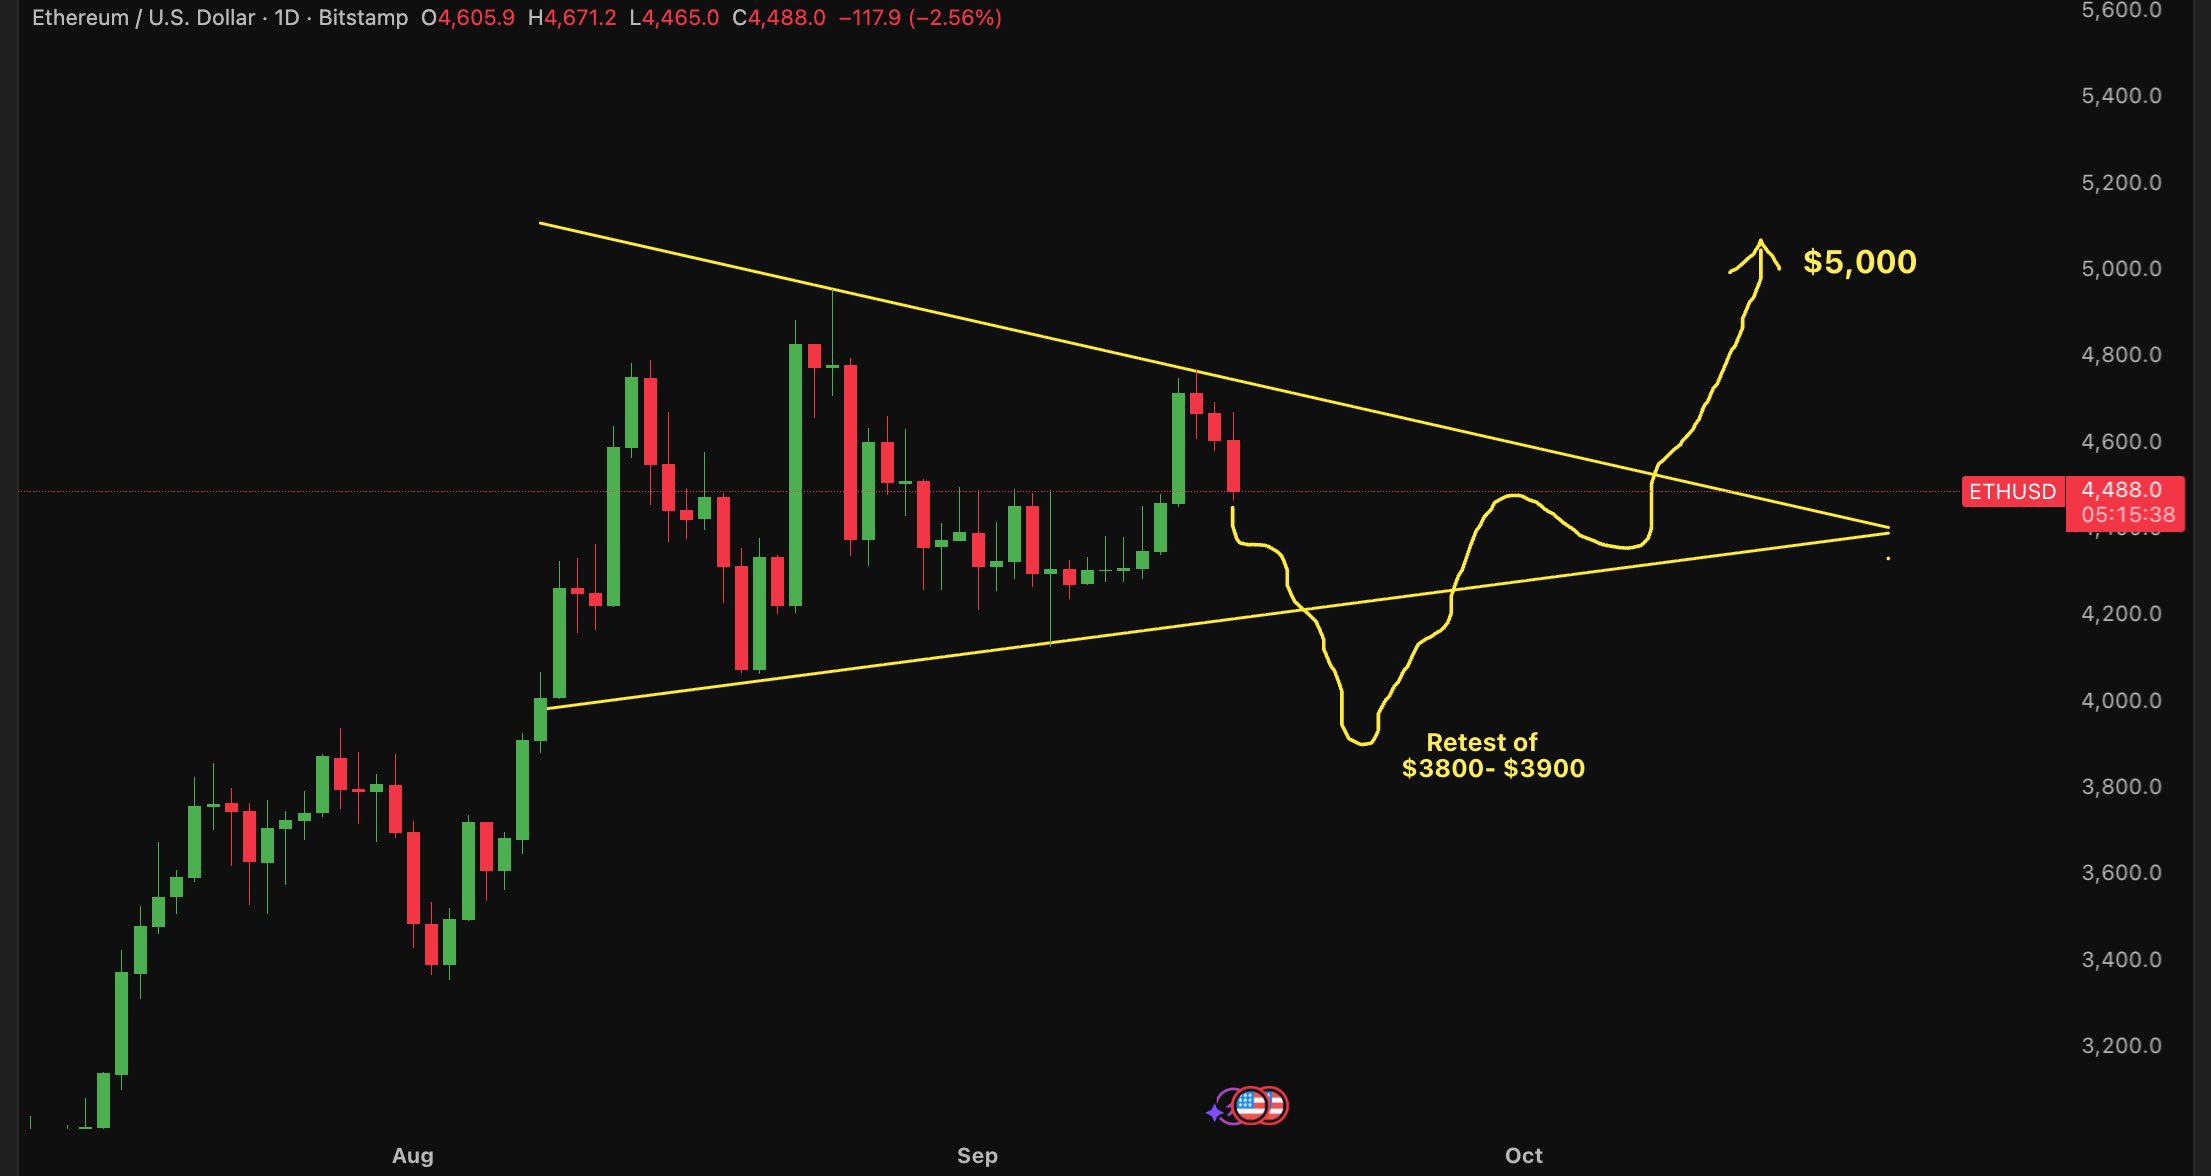
Chartist TheBullishTradR shares a similar view, suggesting that Ethereum could still retrace into the $4,100–$4,300 “super trend support” zone before staging a more substantial reversal higher.
Meanwhile, analyst Luca notes that ETH has reclaimed the golden pocket (0.5–0.618 Fibonacci retracement lines), with price now aligning closely to this zone and the daily Bull Market Support Band.
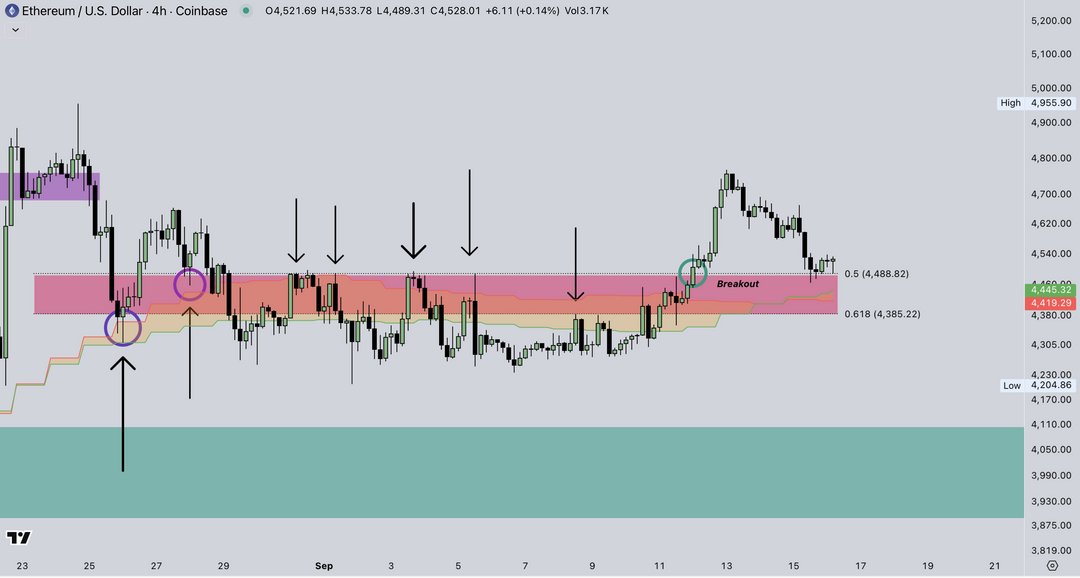
The chartist sees this as a classic “Breakout → Retest setup,” when price breaks above resistance, then pulls back to test it as support before continuing higher. He added:
“As long as the price holds above the golden pocket, I believe the most likely outcome is further upside.”
This article does not contain investment advice or recommendations. Every investment and trading move involves risk, and readers should conduct their own research when making a decision.


