
Reason to trust
Strict editorial policy that focuses on accuracy, relevance, and impartiality
Created by industry experts and meticulously reviewed
The highest standards in reporting and publishing
Strict editorial policy that focuses on accuracy, relevance, and impartiality
Morbi pretium leo et nisl aliquam mollis. Quisque arcu lorem, ultricies quis pellentesque nec, ullamcorper eu odio.
The question reverberating across —whether a decisive break below $105,000 would end the Bitcoin bull cycle—drew a crisp rebuttal from popular market analyst CrediBULL Crypto (@CredibleCrypto). In a pair of late-night posts to his 476,000 followers, he argued that while $105,000 is a key threshold for the “most aggressive” upside path, a loss of that level would not, by itself, terminate the higher-time-frame uptrend.
“No, if $105,000 is lost it’s not ‘over’ it just means the most aggressive/bullish scenario is out of play and a deeper correction is a lot more likely,” he wrote. “HTF structure isn’t broken until/unless $74,000 is lost—all explained in my last Youtube vid so before you ask ‘why so low for HTF invalidation’ go watch the vid :).”
In a second post he reiterated the pivot that has framed his outlook for weeks: “$107-$110,000 has always been the MOST pivotal point on the BTC chart… This is the most likely zone for a full on reversal—it doesn’t mean it is guaranteed of course but this is the last place it makes sense to start flipping bearish.”
How Low Could Bitcoin Price Go?
The posts point back to a YouTube video published two weeks ago, where the analyst maps three paths for Bitcoin’s next leg. Two envision an upside reversal in or just below the current $107,000–$110,000 area, while a third allows for a deeper corrective sweep without violating the secular uptrend.
Related Reading
He is explicit that trend invalidation for the cycle sits much lower—he cites the “mid-$70,000s” as the line in the sand, and, in one passage, places formal invalidation at $74,000–$75,000—because that’s where the prior high-time-frame impulse originated and where the market would, in Elliott-wave terms, erase the larger five-wave structure. That framing is why losing $105,000 would mark a deterioration in momentum rather than a terminal break in structure.
Inside his framework, “Scenario 1”—the idea that price is still working through a compact fourth-wave pause inside an already active impulse—has, by his own admission, grown unlikely. The corrective chop has lasted too long and retraced too deep relative to its second-wave analogue; by classical proportionality, that makes it the wrong degree for a fourth wave. The technical red line for that scenario was $110,000; once reclaimed and then overrun to the downside during the correction, the count’s symmetry broke down.
“Scenario 2,” his preferred bullish configuration, casts the rally off roughly $105,000 as the first completed five-wave impulse of a new advance. In this reading, the market is currently tracing a wave-two pullback with invalidation squarely at $105k.
Related Reading
The implication is arithmetic as much as it is structural: if wave one spanned approximately $20,000 top to bottom, a standard third wave would be larger, pushing toward at least the mid-$130,000s before a fourth-wave pause and a terminal fifth carry the move into the $150,000-plus region. This is why he characterizes $107,000–110,000 as “the best R:R for longs,” the last high-probability staging area for a reversal before invalidation.
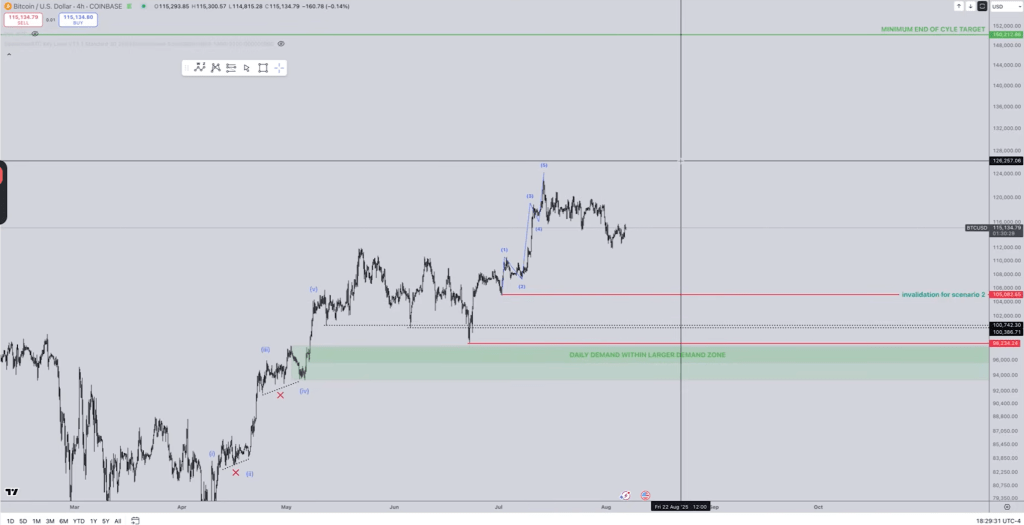
“Scenario 3” keeps the broader May-to-present correction intact. Here the pop above range highs was corrective rather than impulsive—what technicians call a three-leg rise with overlap—and the market still owes a deeper sweep into demand.
He differentiates two shapes: a running flat that defends the June/July lows and finds support in a purple band between ~$103,000 and ~$98,000, and an expanded flat that undercuts those lows and tests the daily demand block that “started at basically 98k,” which price “front-ran… at 98.2k” before bouncing. In both cases the higher-time-frame thesis is unchanged, because the structural invalidation remains far below at $74k–$75k.
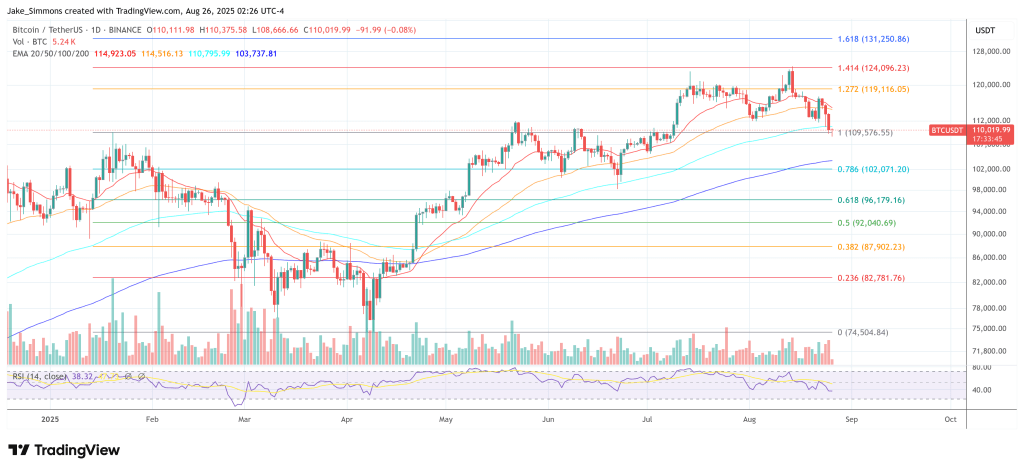
At press time, BTC traded around $110,019 after hitting an intraday low at $108,666.
Featured image created with DALL.E, chart from TradingView.com