A Bitcoin on-chain metric still hasn’t formed the same condition as in the previous bottom, suggesting that the current low may not be in yet.
Stablecoin Exchange Inflows (Top 10) Hasn’t Shown Any Spikes Recently
As pointed out by an analyst in a CryptoQuant post, the top 10 stablecoin exchange inflows saw a rise during the July 2021 bottom.
The “stablecoin exchange inflows (top 10)” is an indicator that measures the sum of the ten largest stablecoin transactions that are heading towards exchanges. The metric includes data of all types of stablecoins.
Since the top ten transfers are usually from the whales, this indicator can tell us whether whales are active on exchanges or not.
Usually, investors shift to stables when they want to escape the volatility associated with most other cryptos. Once these holders feel that the prices are right to re-enter these markets, they buy into other coins using their stablecoins, thus providing a buying pressure to them.
When the value of the top 10 stablecoin exchange inflows is high, it means whales could be sending large amounts of stables to exchanges for buying other coins. Such a trend could therefore be bullish for the prices of cryptos like Bitcoin.
Now, here is a chart that shows the trend in this on-chain indicator over the last few years:
Looks like the value of the metric has been muted in recent days | Source: CryptoQuant
As you can see in the above graph, the stablecoin inflows (top 10) to spot and derivative exchanges have been displayed separately, since spot platforms are what investors use for converting their coins.
It seems like when the Bitcoin bottom formed back in July 2021 during the mini-bear period of the time, the spot exchange version of the metric sharply rose up.
This implies that whales participated in some heavy buying during that time with their stablecoin reserves, paving way for a bullish reversal in BTC.
In recent weeks, the top 10 stablecoin inflows to spot exchanges haven’t shown any significant movements, which means whales aren’t providing any significant buying pressure yet.
If the past trend is anything to go by, this could be an indication that the current Bitcoin bottom still hasn’t formed.
BTC Price
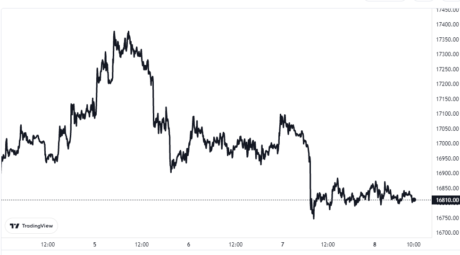
At the time of writing, Bitcoin’s price floats around $16.8k, down 2% in the last week. Over the past month, the crypto has lost 18% in value.
The below chart shows the recent trend in BTC:
The value of the crypto seems to have declined during the last couple of days | Source: BTCUSD on TradingView
Featured image from Kanchanara on Unsplash.com, charts from TradingView.com, CryptoQuant.com


