Glassnode’s model for tracking the “price multiplier” effect for Bitcoin could provide some hints about whether the asset is near the top or not so far.
Bitcoin Is Observing A Multiplier Effect Of 4-5x Right Now
In a new post on X, the lead on-chain analyst at Glassnode, Checkmate, has discussed the “price multiplier” effect of Bitcoin. This effect refers to the fact that the capital that flows into the cryptocurrency is not always (in fact, most of the time) the same as the change reflected in the market cap.
To track the exact ratio between the two, Glassnode has defined the “Realized Capital to Valuation Change Ratio.” This indicator measures how much capital flows into the “Realized Cap” for every unit change in the market cap.
The Realized Cap refers to a capitalization model for Bitcoin that assumes that the real value of each coin in circulation is not the current spot price but the price at the time it was last transferred on the blockchain.
This last transfer could be considered the previous moment the coin changed hands, so the Realized Cap adds up the cost basis or acquisition value of all coins in circulation. Put another way, the Realized Cap is a model that measures the total amount of capital the investors have used to buy Bitcoin.
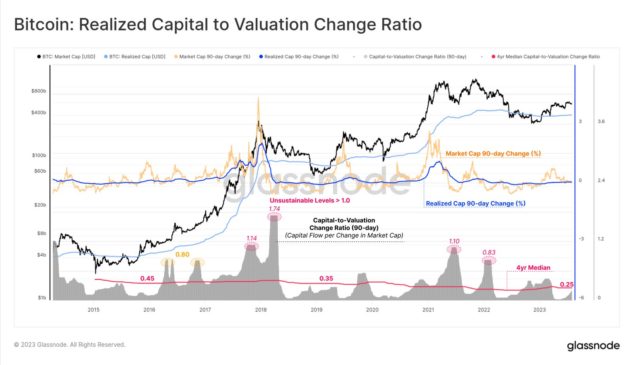
Now, here is a chart that shows the trend in the BTC Realized Capital to Valuation Change Ratio over the past several years:
The data for the 90-day change in the metric | Source: @_Checkmatey_ on X
The above graph shows that the Bitcoin Realized Capital to Valuation Change Ratio (90-day) has recently been below the 4-year median of 0.25. As Checkmate notes, this model suggests the current multiplier effect of BTC is around 4 to 5 times.
This means that for every $0.20 to $0.25 going into the realized cap, the market cap is moving by $1. From the chart, it’s apparent that the multiplier has generally shot up during bull markets.
“Bull market tops often correspond with $0.80 to over $1.0 in capital inflows needed to achieve a $1 change in the market cap (unsustainable < 1x Multipler),” explains the Glassnode lead.
On the other hand, bear markets “often see heightened volatility with $0.2 in capital flows having a $1.0 impact on MCap (5x Multipler),” according to the analyst.
Suppose this historical pattern is anything to go by. In that case, the current Bitcoin multiplier is still at relatively low values, which would imply the cryptocurrency still has a lot of room to go before a potential top is encountered.
Another curious pattern in the ratio is also visible in the same chart. It appears that the 4-year median has been going down as the years have passed. This would mean that BTC’s market cap has, on average, been becoming easier to shift with time.
BTC Price
In the past day, the Bitcoin spot ETFs were finally cleared by the US SEC, and it would appear that the market has reacted by buying this news, as the price has now breached the $48,000 level.

Looks like the price of the coin has shot up over the past day | Source: BTCUSD on TradingView
Featured image from Dmytro Demidko on Unsplash.com, charts from TradingView.com, Glassnode.com
Disclaimer: The article is provided for educational purposes only. It does not represent the opinions of NewsBTC on whether to buy, sell or hold any investments and naturally investing carries risks. You are advised to conduct your own research before making any investment decisions. Use information provided on this website entirely at your own risk.


