Key takeaways:
-
Bitcoin hinges on $115,000 support, risking a drop toward $104,000.
-
Weekly RSI divergence points to a deeper correction.
-
Rising NUPL signals increased profit-taking, hinting $123,000 was the local top.
Bitcoin (BTC) is down on Friday, dropping below $115,000 for the first time since July 25. The inability to crack the resistance at $120,000 for over three weeks now puts the BTC price uptrend in question, at least for the near term.
Will Bitcoin price drop to $104,000?
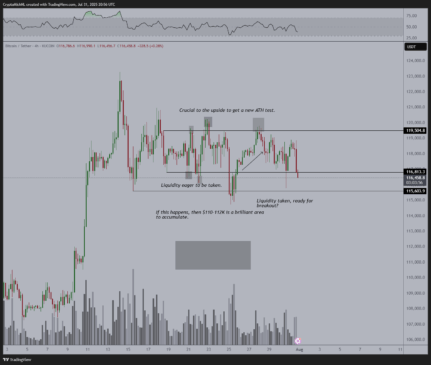
Bitcoin is flirting with downside volatility as it clings to the $115,000 support level, an area market analyst Michaël van de Poppe flagged as essential to continue the uptrend.
Related: Bitcoin ends record month at $115K with BTC price set for ‘vertical’ August
His chart shows that BTC’s drop below $115,600 could trigger a cascade of long-side liquidations and push the price back toward the $110,000–$112,000 region.
Data from Cryptox Markets Pro and TradingView shows that Bitcoin dropped to an intraday low of $114,100 on Friday. This price action was accompanied by $172 million long BTC liquidations, per CoinGlass data.
As Cryptox reported, the odds of a deeper correction to $104,000 will increase if the $116,000 level is not reclaimed shortly.
Bitcoin’s divergence hints at $92,000
Adding to the short-term bearish bias, Bitcoin’s weekly chart is flashing a classic bearish divergence between price and momentum.
The chart below shows that while BTC/USD formed higher highs over recent months, the relative strength index (RSI) has carved out lower highs, suggesting waning bullish momentum.
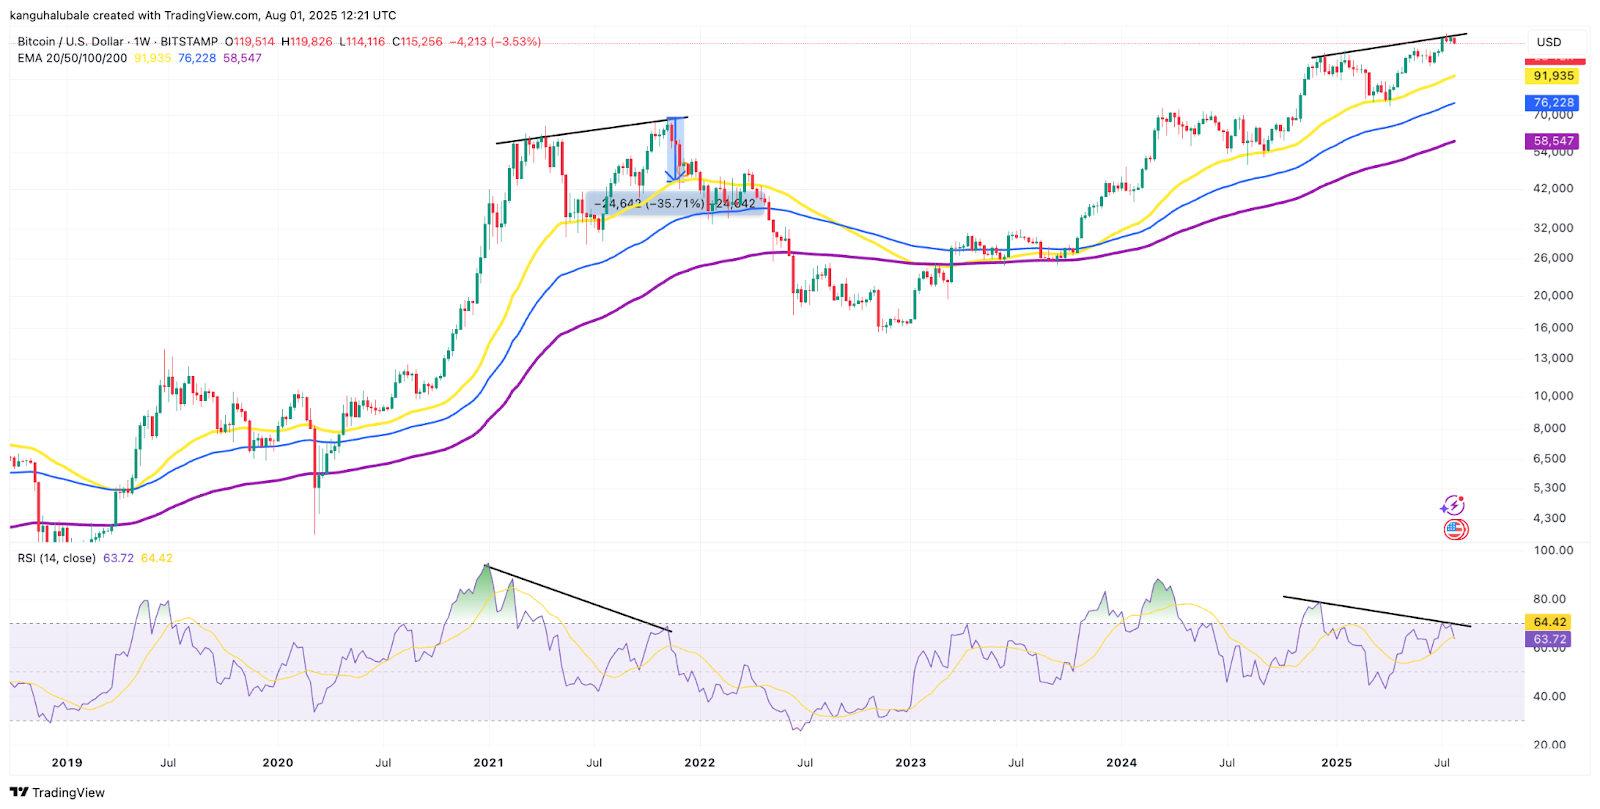
Such a signal often precedes deeper pullbacks, as it did ahead of the 2021 market top.
If history repeats, BTC could retrace toward its 50-week exponential moving average (50-week EMA; the yellow wave), currently near $92,000. This trendline also served as key support during previous bull markets, making it a logical target for any mid-cycle correction.
A similar divergence was observed on the monthly chart by Crypto Trader AlejandroBTC, who said it’s a sign that Bitcoin’s cycle is nearing its end.
“Bitcoin is flashing a triple bearish divergence on the monthly RSI. It’s the kind of setup that ends cycles.”
Bitcoin’s Net Unrealized Profit/Loss (NUPL) also flashes warning signs. The metric is currently within the 0.5–0.6 zone, a level historically linked with local tops.
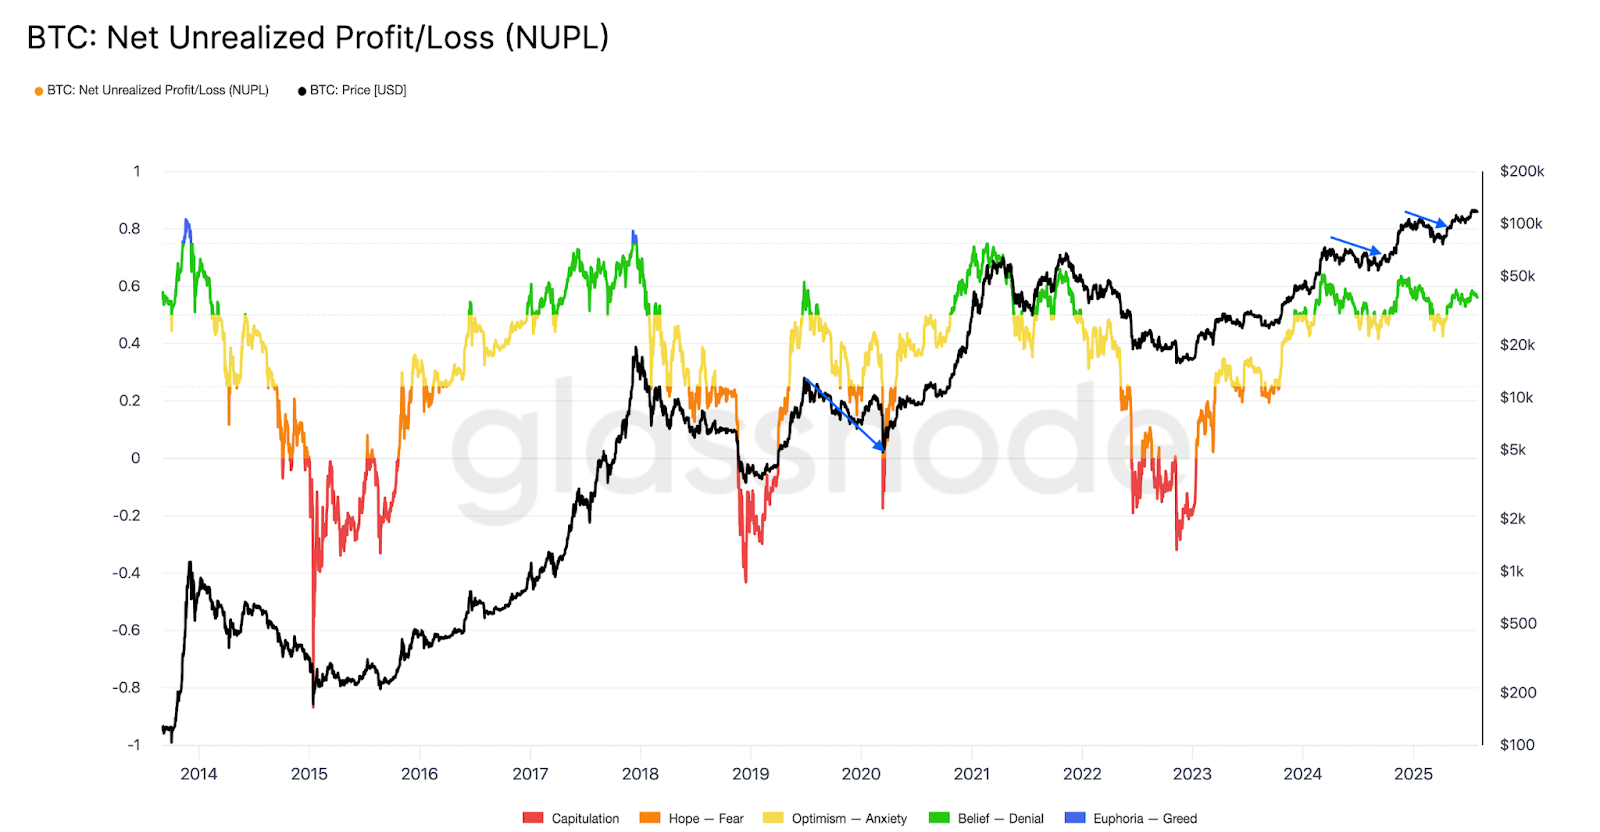
With more than 92% of supply in profit at current prices, there is a likelihood of an increase in sell-side pressure. Such setups in 2020, in March 2024 and January 2025, preceded sharp corrections, raising the possibility of similar pullbacks in August.
Nevertheless, CoinGlass’ 30 bull market peak indicators suggest that Bitcoin is showing no signs of overheating with $138,000 BTC price in play. Other bullish analysts anticipate that Bitcoin still has three months left before a price top of around $150,000.
This article does not contain investment advice or recommendations. Every investment and trading move involves risk, and readers should conduct their own research when making a decision.


