
Key points:
-
Bitcoin is trading back below its recent all-time highs, grilling support at levels it first encountered in late 2024.
-
A “deeper pullback” may result before bulls find the momentum to return to price discovery.
-
Profit-taking lies at the heart of current resistance, analysis says.
Bitcoin (BTC) risks a “deeper correction” as the next phase of its bull market faces a temporary setback.
Bitcoin profit-taking causes bull run hiatus
Analysis is warning of sub-$100,000 prices as data from Cointelegraph Markets Pro and TradingView shows BTC/USD dropping 8%.
Bitcoin returned below its old all-time highs on May 31 as the latest correction nears $9,000 below its latest record peak.
After bulls encountered resistance from multiple sources, onchain indicators soon began to forecast a slowdown in bullish momentum.
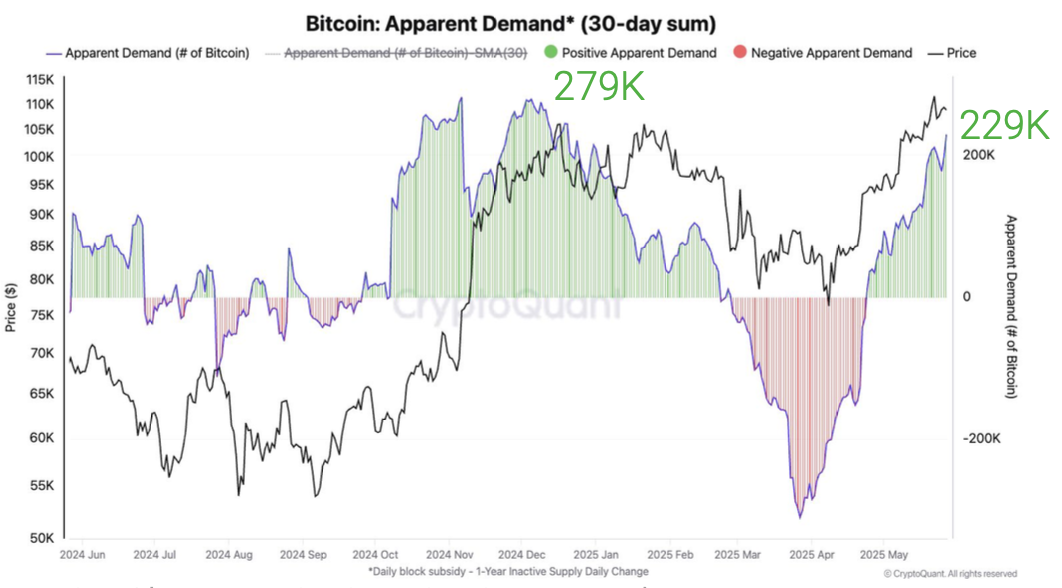
In its latest research report sent to Cointelegraph, onchain analytics platform CryptoQuant saw that “some of Bitcoin’s demand metrics may be reaching a short-term top, which could imply a pause in the current rally.”
“CryptoQuant’s estimate of Bitcoin’s demand growth in the last 30 days is at 229K, which is near the previous demand growth top of 279K Bitcoin reached in December 2024,” its authors wrote.
“Additionally, whale-held Bitcoin balances have increased by 2.8% over the past month, a pace that often precedes a slowdown in whale accumulation.”
CryptoQuant added that unrealized profits were, on average, over 30% at $111,000, likewise hinting at an imminent pause.
BTC price “deeper pullback” expected
As such, market participants, while staying bullish on a return to price discovery, still see lower levels coming first.
Related: How low can the Bitcoin price go?
“On the daily chart, BTC has broken below the previous all-time high and is facing rejection at that same level,” popular trader Mags wrote in part of his latest X analysis.
“This might look like the start of a deeper correction.”
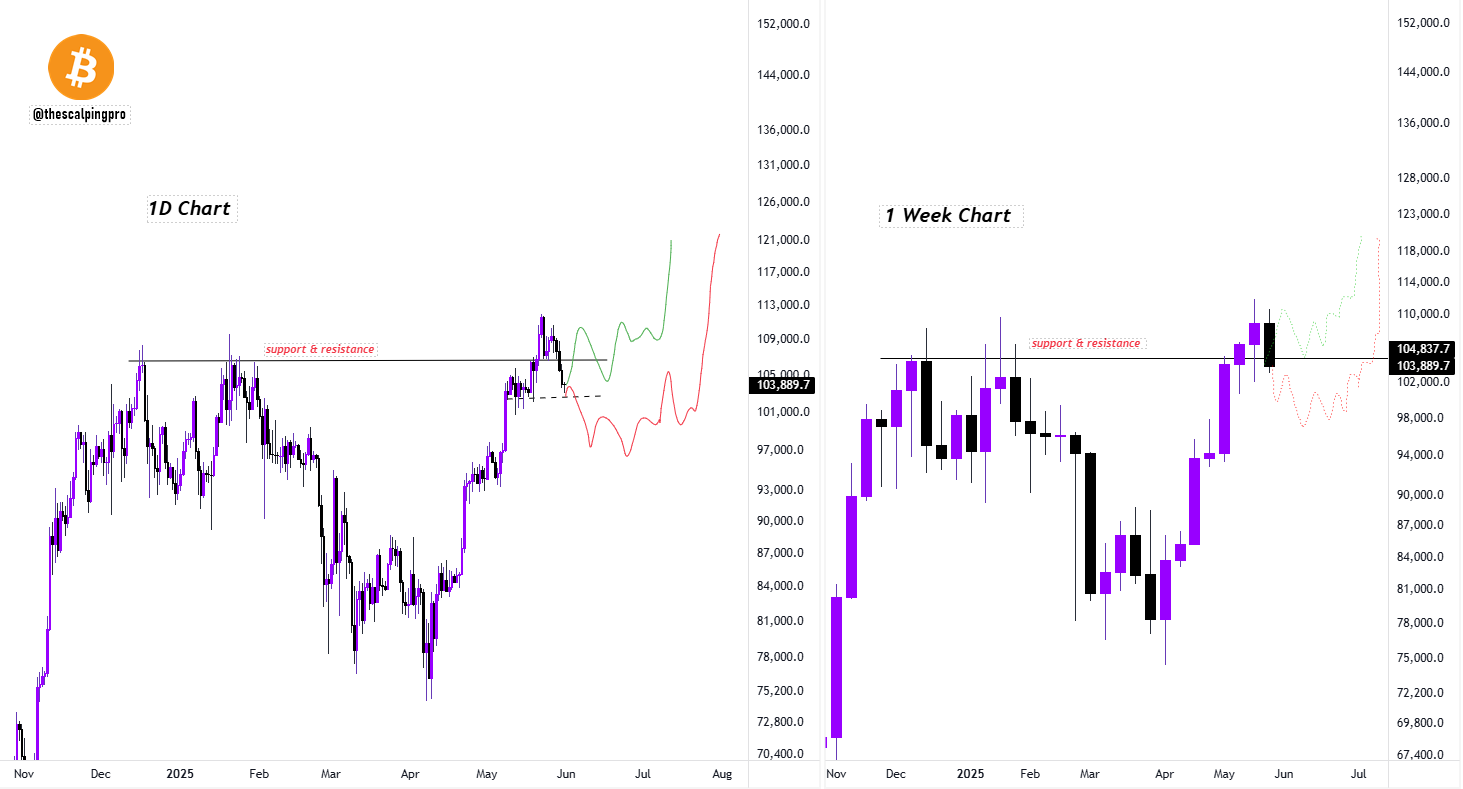
Mags focused on the upcoming weekly candle close as a key test of bulls’ strength, with the price still able to retake the old record close at $104,450 from December 2024 on weekly timeframes.
“If BTC closes below the horizontal support and resistance line on the weekly, we could see a deeper pullback possibly forming an inverse Head and Shoulders before the next leg up,” he concluded.
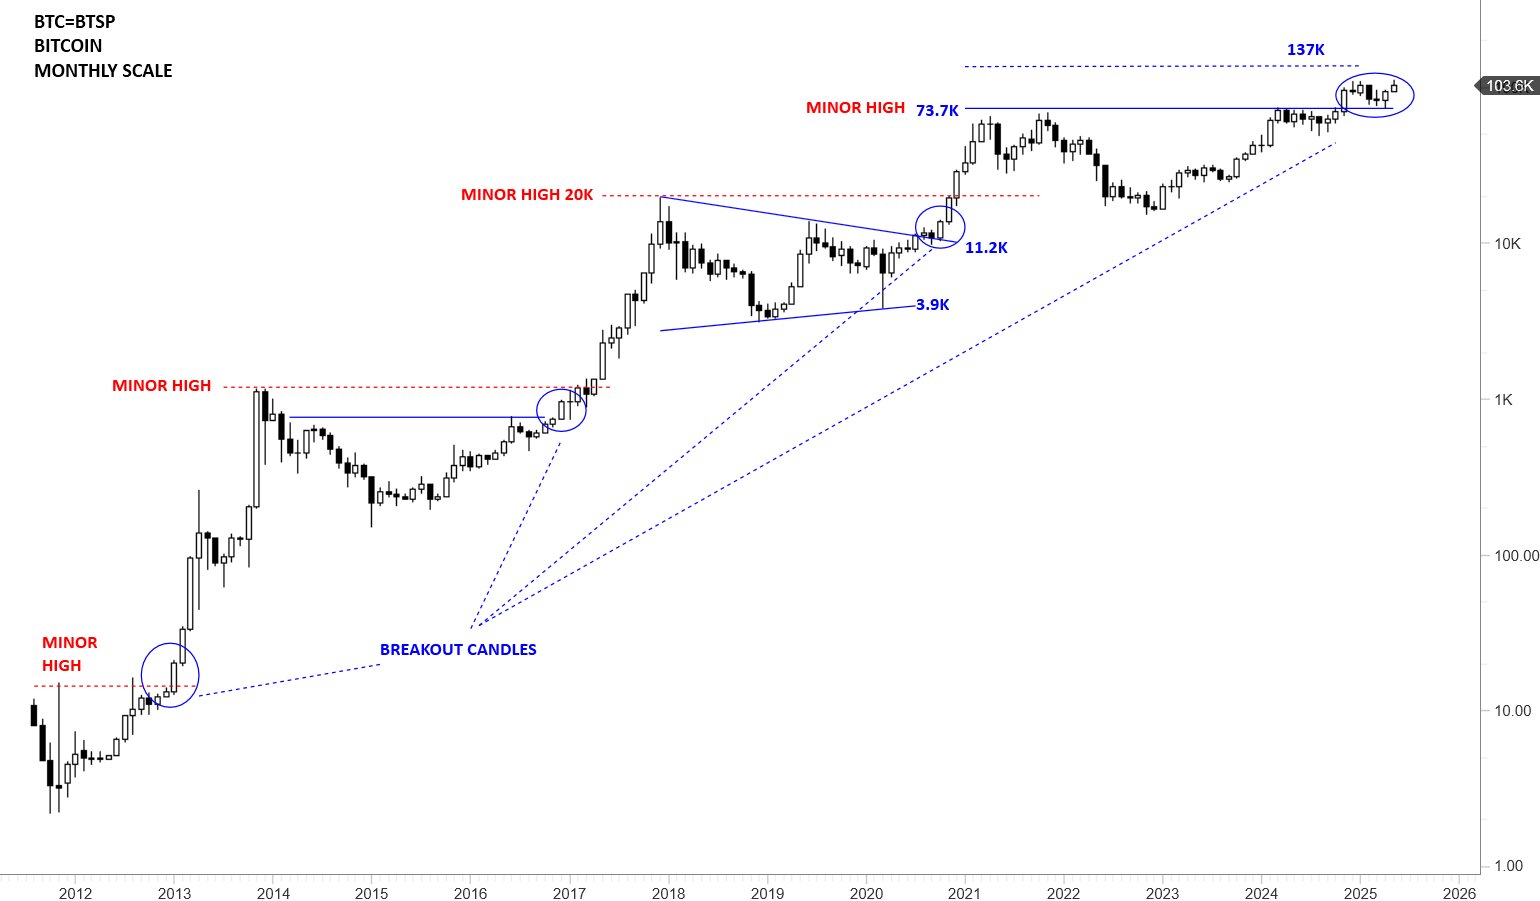
Trader and analyst Aksel Kibar agreed that the bull market comeback “might be delayed.”
“Bullish interpretation intact as long as price holds above 73.7K,” he told X followers about the monthly BTC/USD chart.
Kibar retained his midterm target of $137,000, one in play throughout 2025.
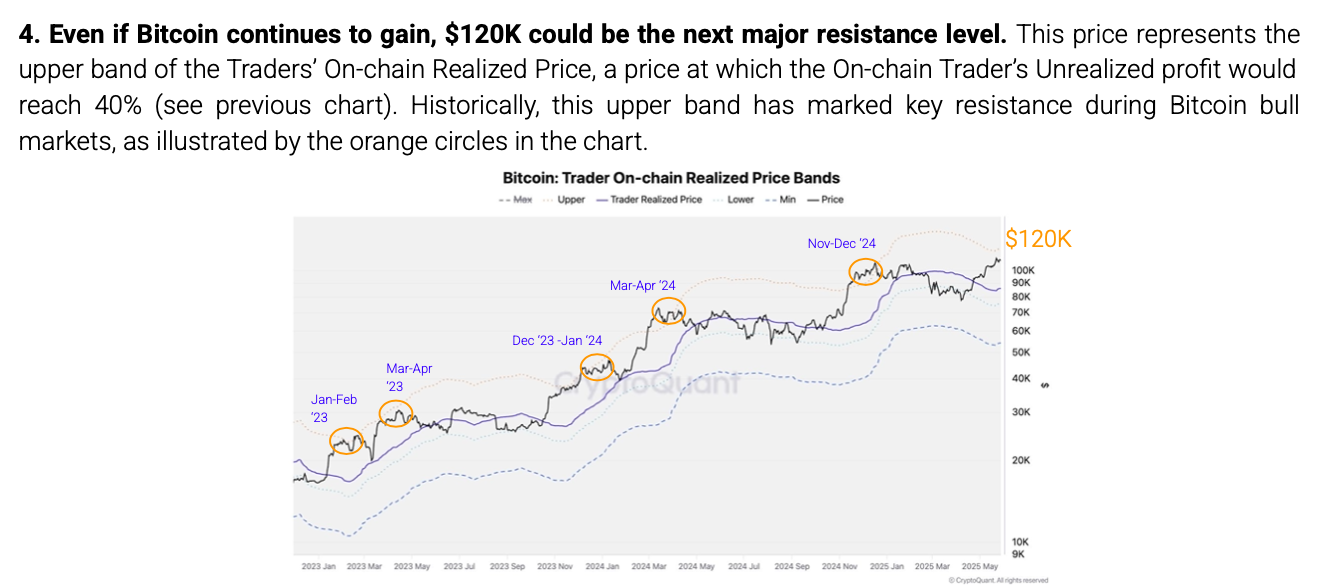
CryptoQuant meanwhile sees price stopping off sooner, with $120,000 on the radar as a key profit-taking station.
This article does not contain investment advice or recommendations. Every investment and trading move involves risk, and readers should conduct their own research when making a decision.


