On-chain data shows the Bitcoin Puell Multiple has recently declined into the historical bottom zone as BTC’s continued consolidation.
Bitcoin Puell Multiple Is Now Under The 0.4 Level
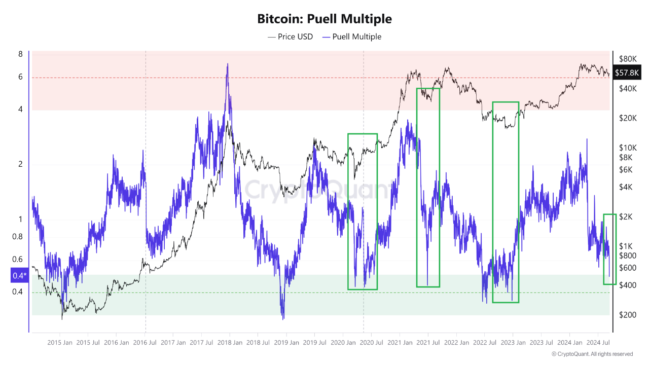
As an analyst in a CryptoQuant Quicktake post explained, the BTC Puell Multiple has declined under 0.4 for the first time since the end of 2022. The “Puell Multiple” here refers to a popular on-chain indicator that keeps track of the ratio between the daily Bitcoin miner revenue and the 365-day moving average (MA) of the same.
The daily miner revenue here refers to the USD value of the BTC amount the chain validators receive as compensation for solving blocks on the network. Miners also earn revenue from another source, the transaction fees, but in the context of the Puell Multiple, only the first component, often called the Issuance, is relevant.
When the value of this ratio is greater than 1, miners are currently making more revenue from block subsidy than the average for the past year. Similarly, it being under the threshold suggests these chain validators are earning less than usual.
Now, here is a chart that shows the trend in the Bitcoin Puell Multiple over the past decade:
As displayed in the above graph, the Bitcoin Puell Multiple had shot up earlier in the year and peaked in April. The rally mainly caused this surge that BTC had witnessed in the first quarter of 2024.
It’s apparent from the chart, though, that the indicator had observed a sharp plunge under the 1 mark right after this peak. The reason behind this lies in an event that had occurred then: the fourth Halving.
Halvings are periodic events programmed into the Bitcoin blockchain that permanently slash the BTC block subsidy in half every four years. With the Issuance being halved during the latest such event, it makes sense that the Puell Multiple registered a crash.
As BTC’s price has been showing a slow descent in the months since then, the USD value of the miner revenue has also been declining, which has naturally been reflected in the Puell Multiple. With its latest downward move, the indicator is under the 0.4 level.
Historically, the zone below this 0.4 mark has proven significant for the Bitcoin price. As the quant has highlighted in the graph, the asset has tended to form bottoms when the metric has been in this region.
The last time Puell Multiple was in this bottoming zone was when the cryptocurrency had observed its bear market lows in 2022. Given these past examples, it’s possible that the Bitcoin price would follow and show something similar this time.
That said, the price has generally only reached a bottom after BTC has spent some time in this zone. As such, it may be a while before the coin can reach a rebound, assuming the pattern holds.
BTC Price
Bitcoin has been trying to move beyond the $58,000 mark during the past day, but the asset has been unable to gather enough momentum, with the latest attempt sending the coin to $57,600.


