
Litecoin price started a fresh decline from the $80 resistance against the US Dollar. LTC is struggling and remains at a risk of more losses towards the $55 support.
- Litecoin started a fresh decline from the $85 resistance against the US Dollar.
- The price is now trading below $70 and the 100 simple moving average (4-hours).
- There was a break below a key contracting triangle with support near $75.00 on the 4-hours chart of the LTC/USD pair (data feed from Kraken).
- The price could continue to move down towards $55 in the near term.
Litecoin Price Turns Red
This past month, litecoin price saw a strong increase above the $70 level against the US Dollar. LTC price was able to clear the $80 resistance level, outperforming both bitcoin and ethereum.
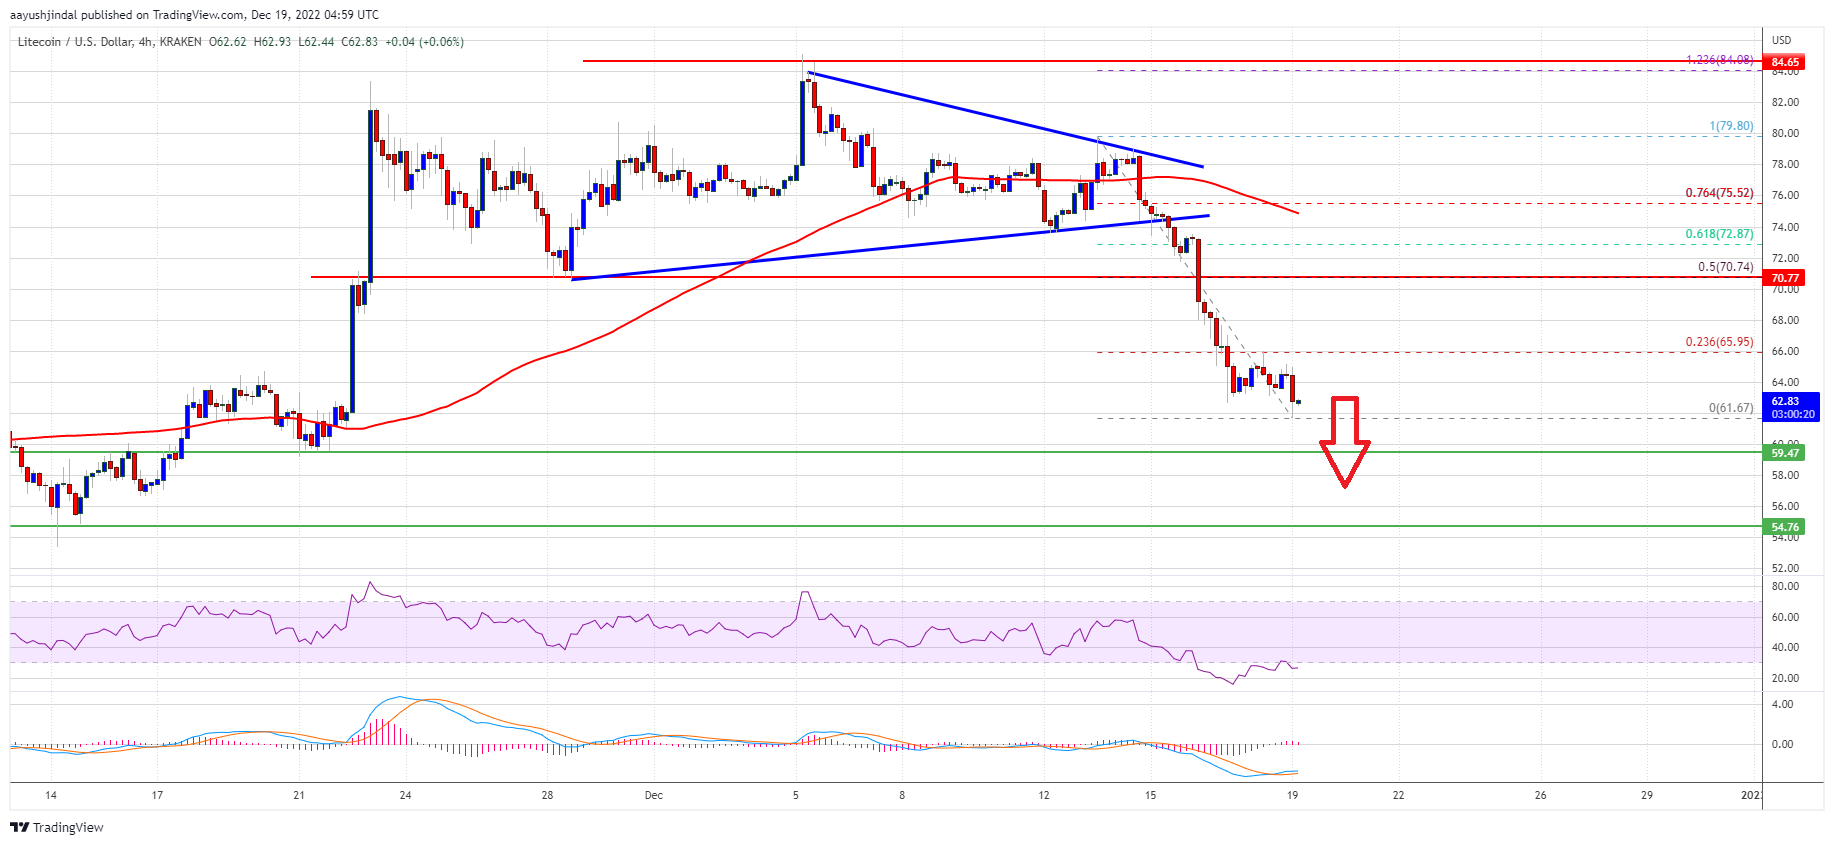
However, the bears remained active near the $85 zone. There was a topping pattern formed near the $85 level before the price started a fresh decline. There was a clear move below the $80 and $78 support levels. Besides, there was a break below a key contracting triangle with support near $75.00 on the 4-hours chart of the LTC/USD pair.
Litecoin price is now trading below $70 and the 100 simple moving average (4-hours). A low is formed near $61.67 and the price is now consolidating losses.
On the upside, an immediate resistance is near the $66.00 level. It is near 23.6% Fib retracement level of the recent decline from the $79.80 swing high to $61.67 low. The first major resistance is near the $70.00 level.
Source: LTCUSD on TradingView.com
The 50% Fib retracement level of the recent decline from the $79.80 swing high to $61.67 low is also near $70. If there is a clear break above the $70 resistance, the price could start a strong increase. In the stated case, the price is likely to continue higher towards the $75 and $78 levels. Any more gains might send ltc price towards the $80 resistance zone.
More Losses in LTC?
If Litecoin price fails to clear the $70.00 resistance level, there could be more losses. An initial support on the downside is near the $61.60 level.
The first major support is forming near the $60.00 level. Any further losses may perhaps send the price towards the $55.00 support in the coming sessions.
Technical indicators:
4-hours MACD – The MACD is slowly gaining pace in the bearish zone.
4-hours RSI (Relative Strength Index) – The RSI for LTC/USD is below the 50 level.
Major Support Levels – $60.00 followed by $55.00.
Major Resistance Levels – $70.00 and $75.00.


