Bitcoin and most major altcoins are selling off on rallies, proof that investor sentiment remains negative in the short term.
The United States stock markets are trying to recover on reports that the debt ceiling talks are showing promise and a debt default may be avoided. However, the same enthusiasm is not seen in the cryptocurrency markets. Bitcoin (BTC) slipped back below the $27,000 support on May 17, indicating that buyers are struggling to sustain the relief rallies.
Institutional investors seem to be booking profits due to the macro uncertainty. CoinShares’ Digital Asset Fund Flows Report shows a total outflow of $200 million from digital asset investment products in the past four weeks.
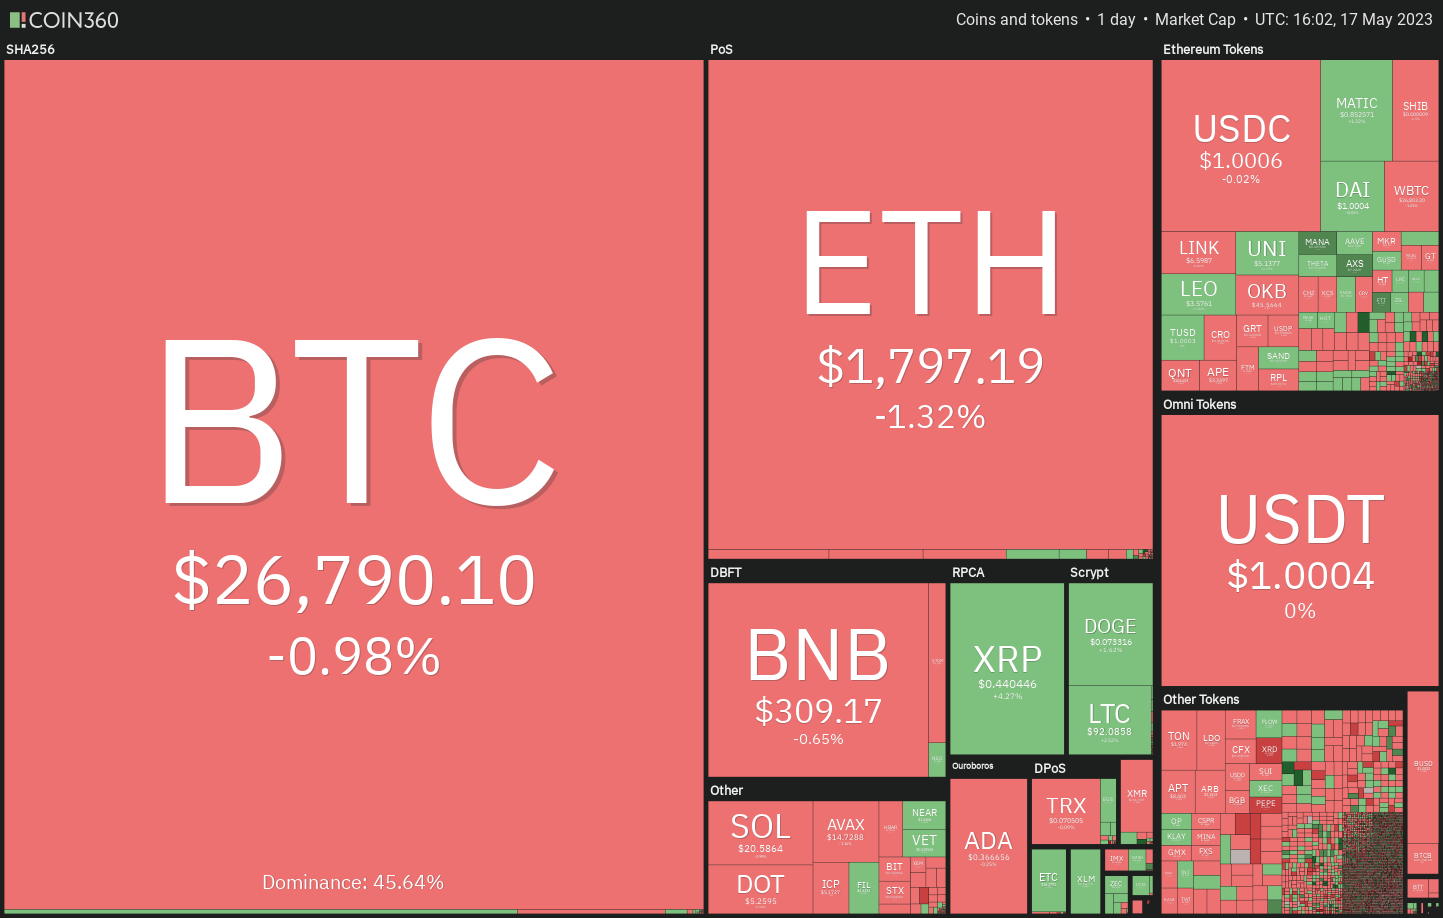
While the short-term picture remains negative, the chart structure on Bitcoin has not been broken. Bitcoin has corrected about 15% from its local high of $31,000 made on April 14, but it remains above $25,000, indicating that the weakness is looking like a corrective phase in a bull move.
What are the important support levels that the bulls need to hold to launch the next rally in Bitcoin and altcoins? Let’s study the charts of the top 10 cryptocurrencies to find out.
Bitcoin price analysis
Bitcoin’s recovery stalled at the 20-day exponential moving average (EMA) at $27,694 on May 15, indicating that the sentiment remains negative and the bears are selling on rallies.
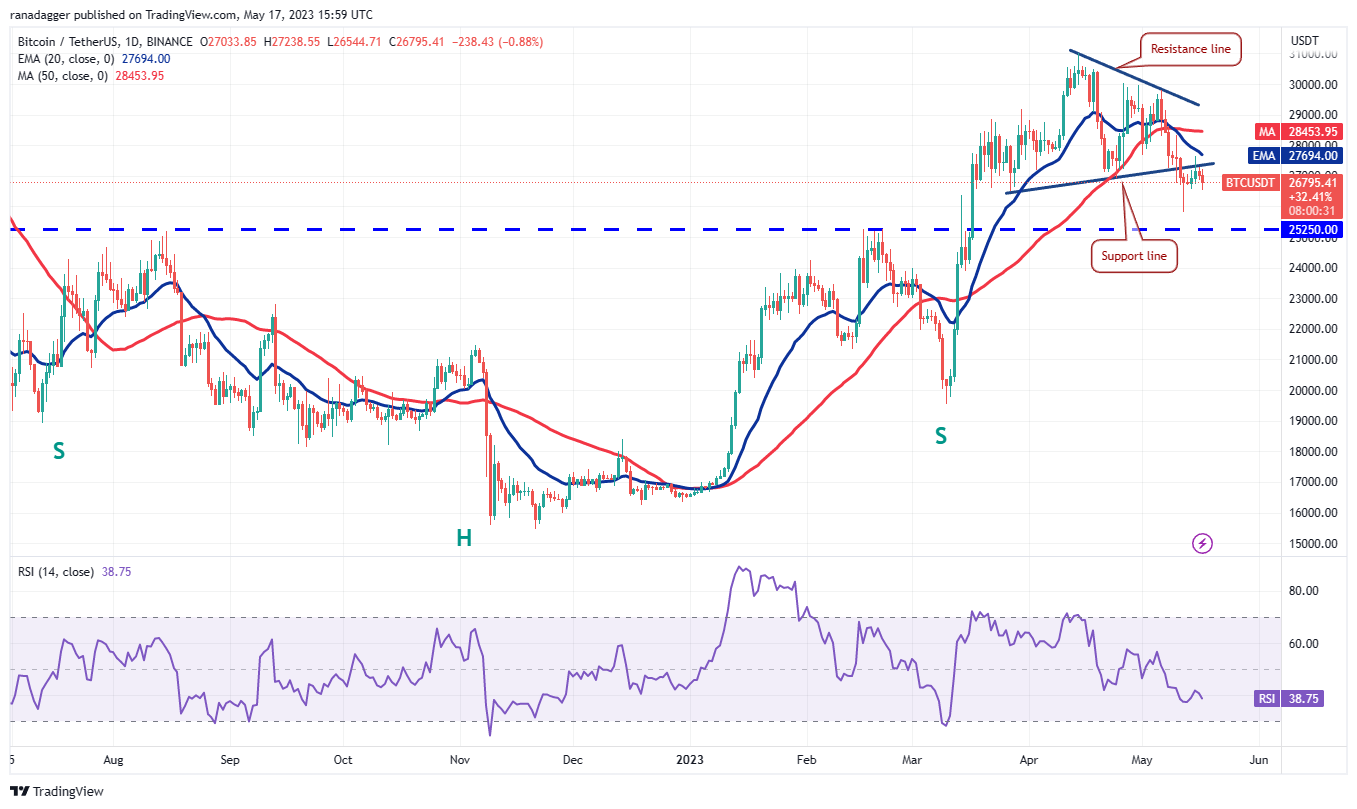
The bears will try to sink the price below the immediate support at $26,500, which could open the doors for a decline to $25,250. This remains the key level to keep an eye on because a break below it may accelerate selling. The BTC/USDT pair could then plunge to $20,000.
Instead, if the price rebounds off $25,250, it will suggest that bulls are trying to defend the neckline of the inverse head-and-shoulders pattern. Starting a new rally is a tough task for the bulls because the recovery is likely to face selling at the moving averages and again at the resistance line.
Ether price analysis
Ether (ETH) turned down from the 20-day EMA ($1,844) on May 17, indicating that the bears are protecting the level with vigor.
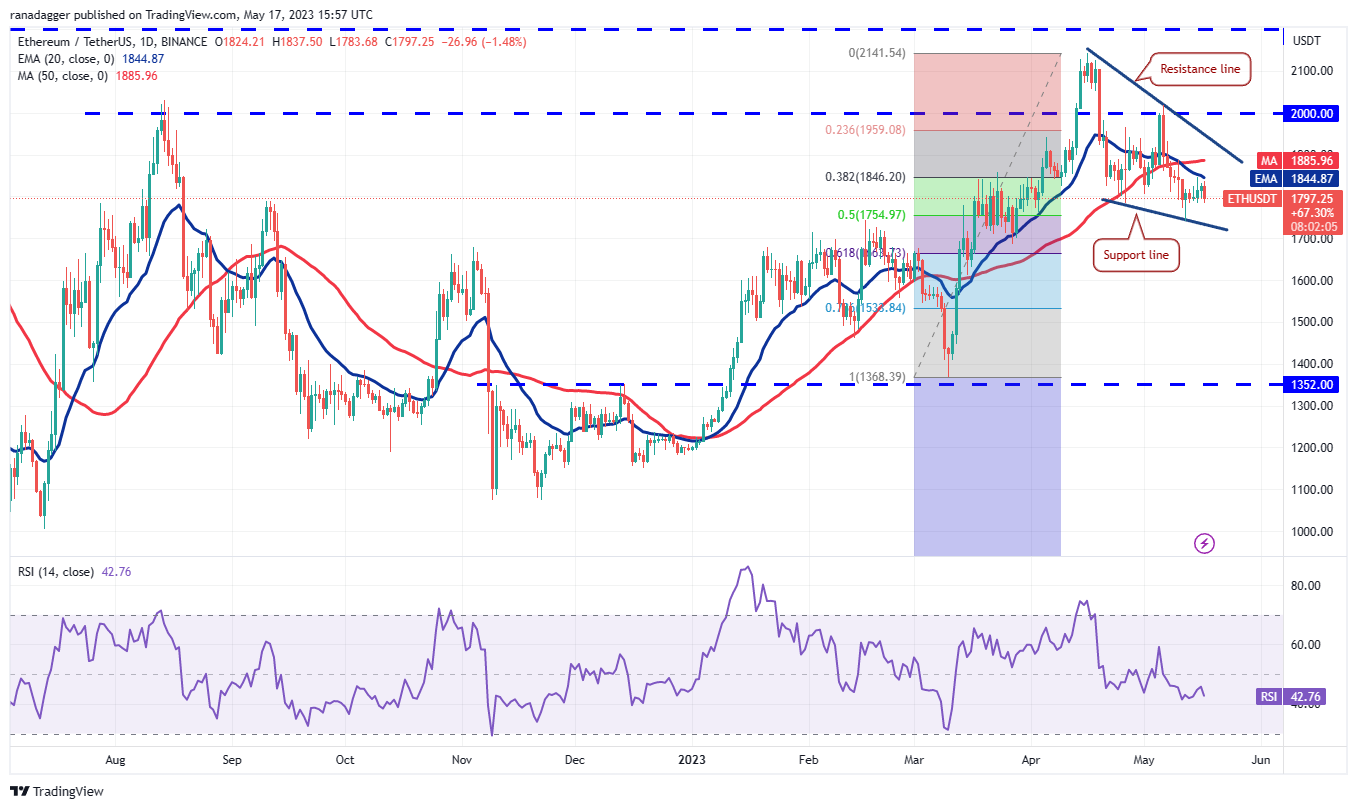
The price action of the past few days has formed a falling wedge pattern, and the ETH/USDT pair could slide to the support line. This is an important level to watch out for because if bears yank the price below the wedge, the pair could drop to $1,600.
Alternatively, if the price rebounds off the support line, the bulls will make another attempt to thrust the pair above the 20-day EMA. If they manage to do that, the pair could rise to the resistance line of the wedge.
BNB price analysis
BNB (BNB) turned down from the 20-day EMA ($316) on May 15, indicating that the bears are active at higher levels.
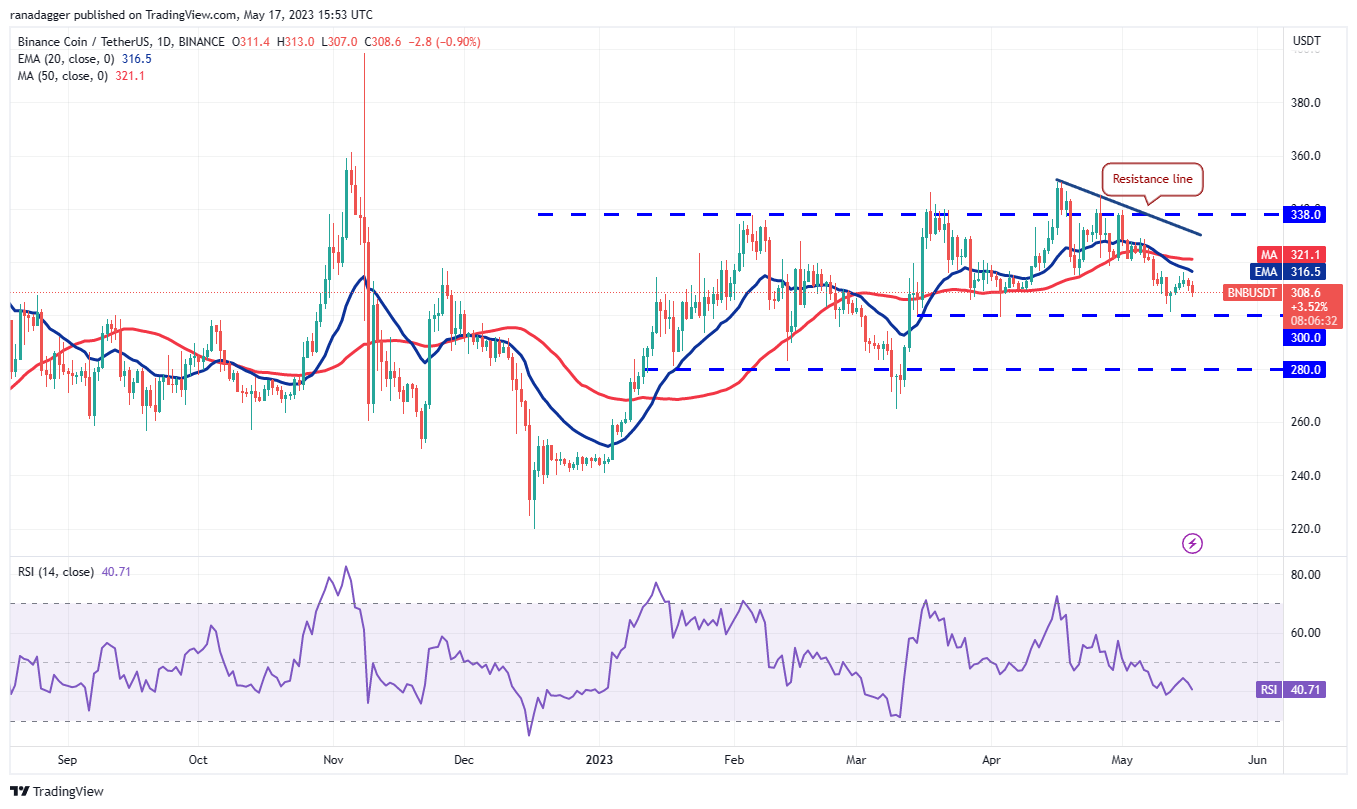
Sellers will again try to pull the price to the strong support at $300. This is an important level for the bulls to defend because if they fail to do that, the BNB/USDT pair could extend the decline to $280.
On the contrary, if the price bounces off $300, it will signal demand at lower levels. The pair could then again rise to the moving averages. Buyers will have to clear this hurdle to enhance the prospects for a rally to the resistance line.
XRP price analysis
After trading in a tight range near $0.43 for several days, XRP (XRP) broke above the overhead resistance on May 16.
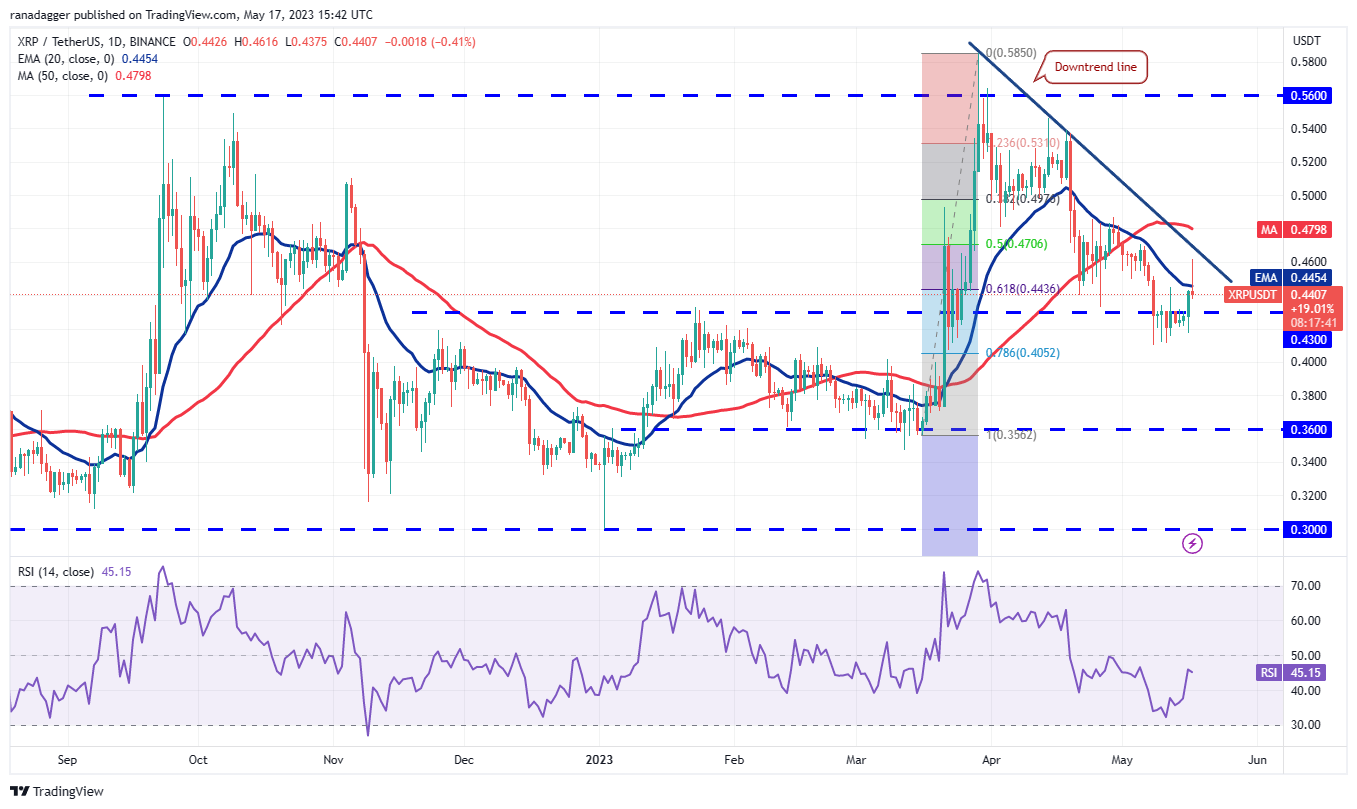
The bulls continued their buying and shoved the price above the 20-day EMA ($0.44) on May 17. However, the long wick on the day’s candlestick shows that the bears are selling the relief rallies to the downtrend line. This suggests that the XRP/USDT pair may oscillate between the downtrend line and $0.40 for some time.
Buying could accelerate after the bulls drive and sustain the price above the 50-day simple moving average (SMA) at $0.48. That may clear the path for a potential rally to the overhead zone of $0.54 to $0.58.
Cardano price analysis
The bulls tried to push Cardano (ADA) above the $0.38 resistance on May 15 and May 17, but the long wick on the candlesticks shows that the bears are fiercely defending the level.
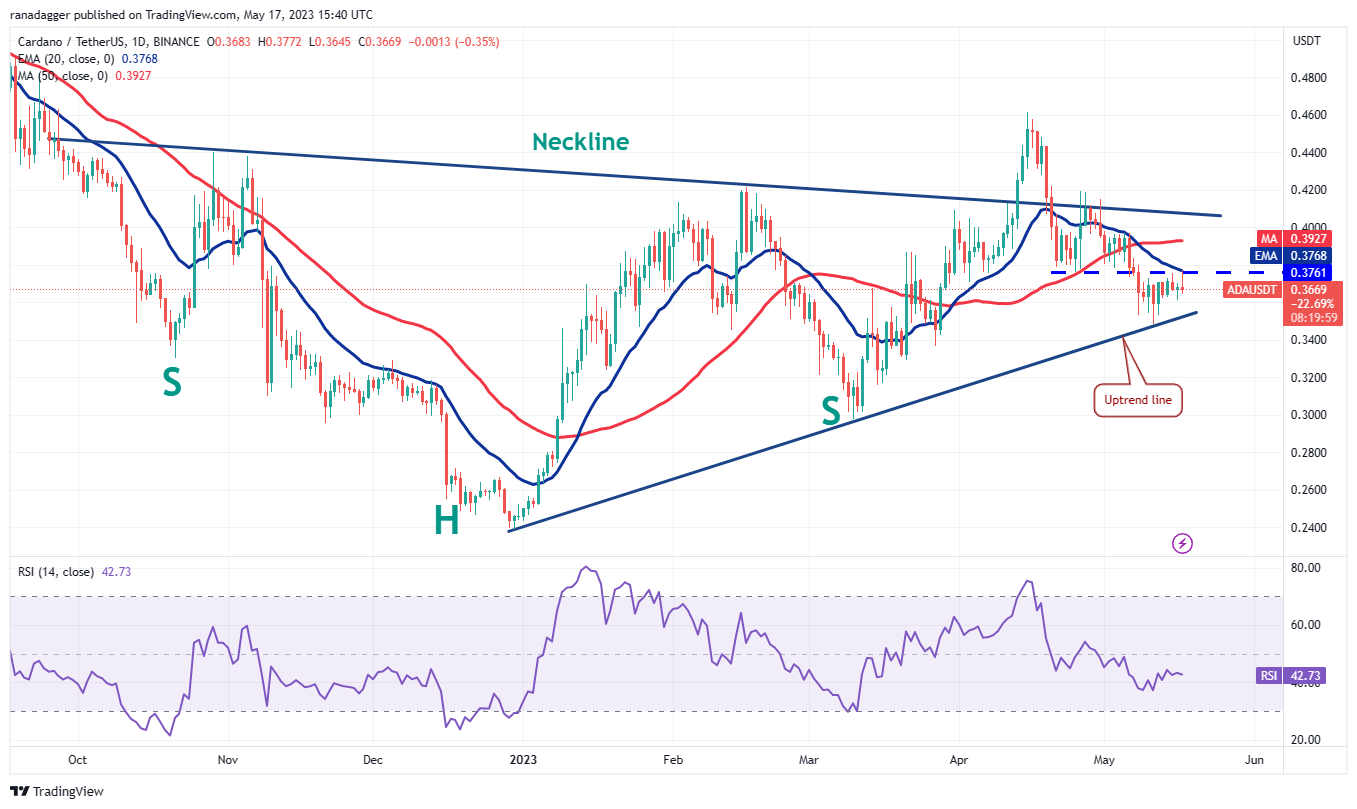
The 20-day EMA ($0.37) is trending down, and the relative strength index (RSI) is near 43, suggesting that bears have a slight edge. Sellers will next try to sink the price below the uptrend line. If they can pull it off, the ADA/USDT pair could tumble to $0.30.
On the contrary, if the price turns up from the current level or the uptrend line and climbs above $0.38, it will indicate that the bulls are back in the driver’s seat. The pair may then rally to $0.42, which is again likely to act as a strong barrier.
Dogecoin price analysis
Dogecoin (DOGE) is finding buyers at $0.07, but the failure to achieve a strong bounce indicates that demand dries up at higher levels.
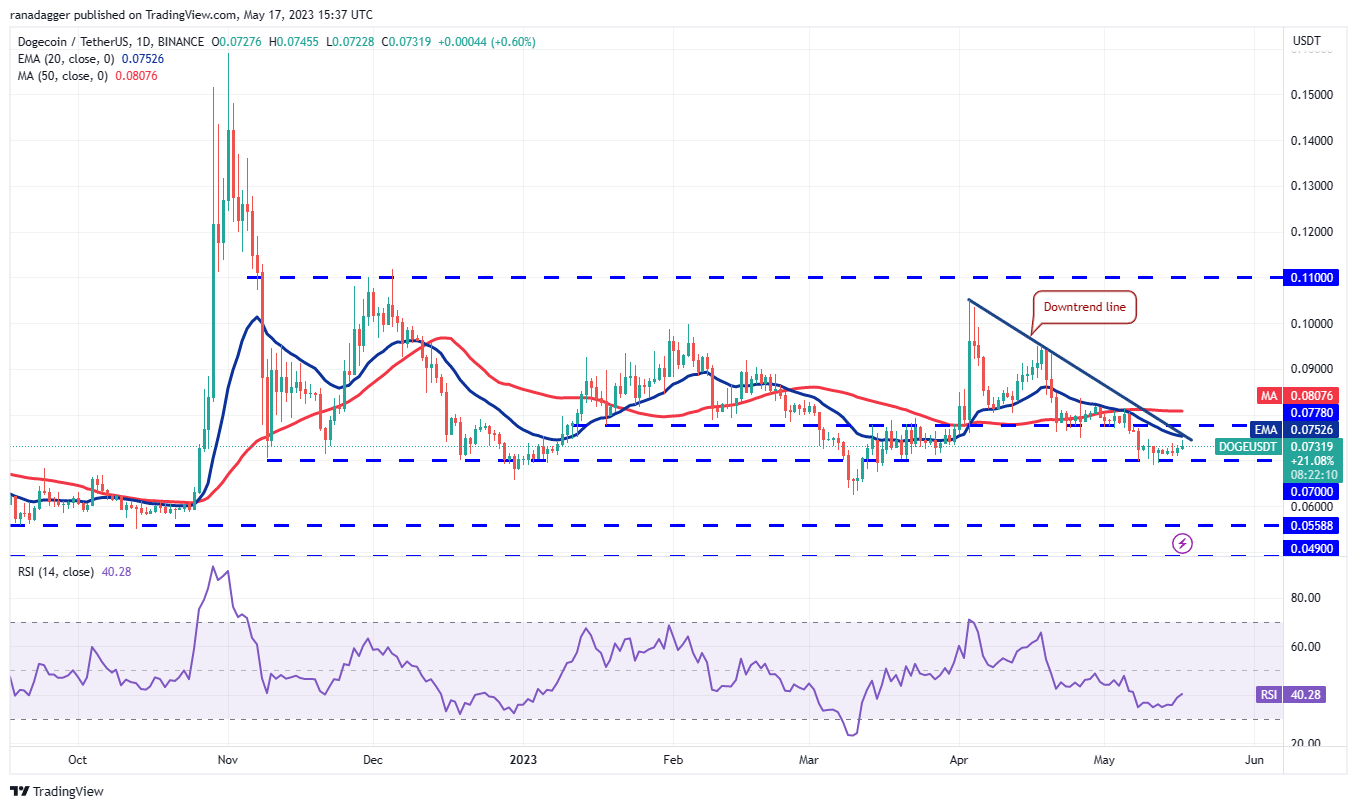
The bears are expected to fiercely defend the zone between the downtrend line and the 50-day SMA ($0.08). If the price turns down from this zone, the bears will make another attempt to sink the DOGE/USDT pair below $0.07.
Another possibility is that the price shoots up from the current level and rises above the 50-day SMA. If that happens, it will suggest the start of a strong relief rally. The pair may first rally to $0.10 and thereafter to $0.11.
Polygon price analysis
Polygon (MATIC) has been stuck in a narrow range between $0.82 and $0.88 for the past few days, indicating indecision among buyers and sellers.
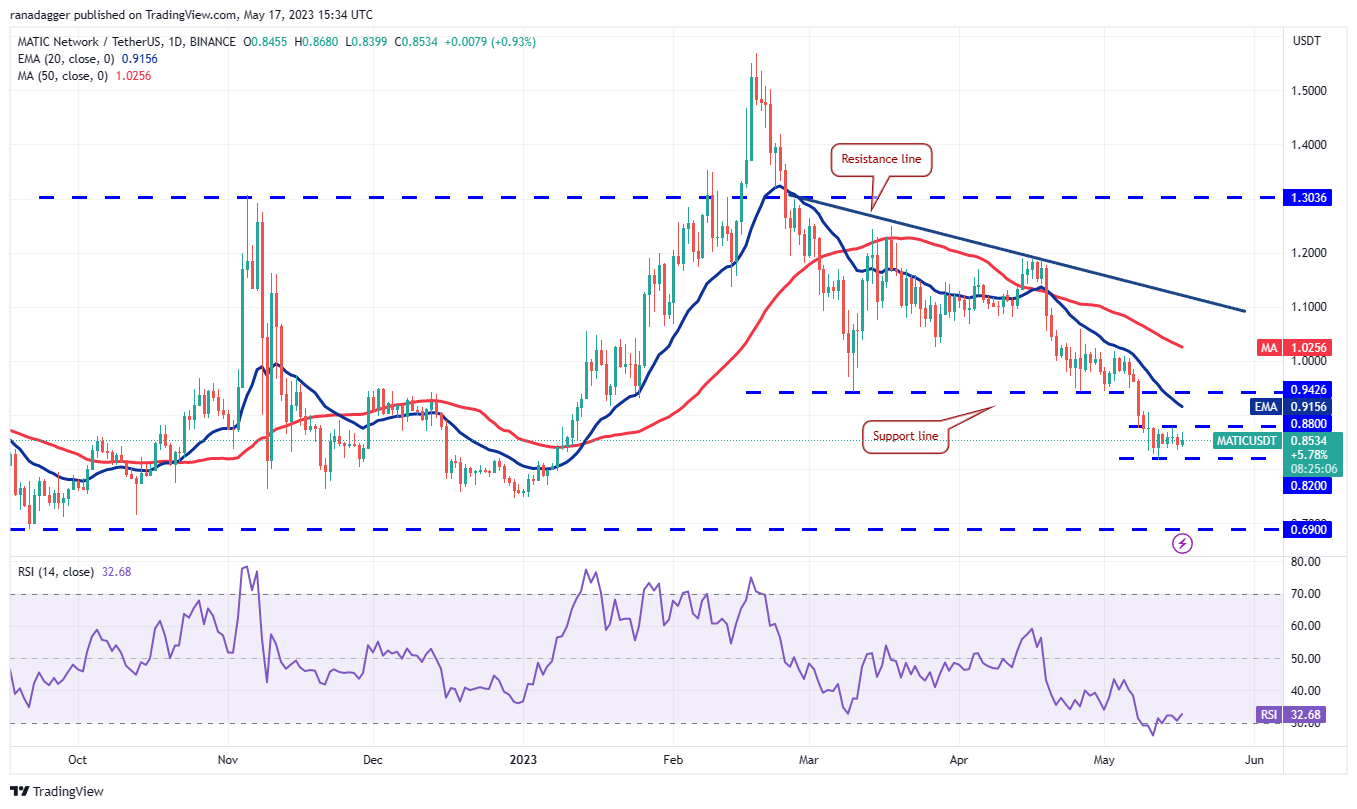
The downsloping moving averages and the RSI near the oversold territory indicate that bears are in control. If the price breaks below $0.82, the selling could intensify and the MATIC/USDT pair may slump to $0.69.
On the upside, the bulls are likely to face stiff resistance in the zone between the 20-day EMA ($0.91) and $0.94. A break above this zone will be the first indication that the selling pressure is reducing.
Related: Why is XRP price up today?
Solana price analysis
Buyers tried to push Solana (SOL) above the downtrend line on May 15, but the long wick on the candlestick shows that the bears are guarding the level.
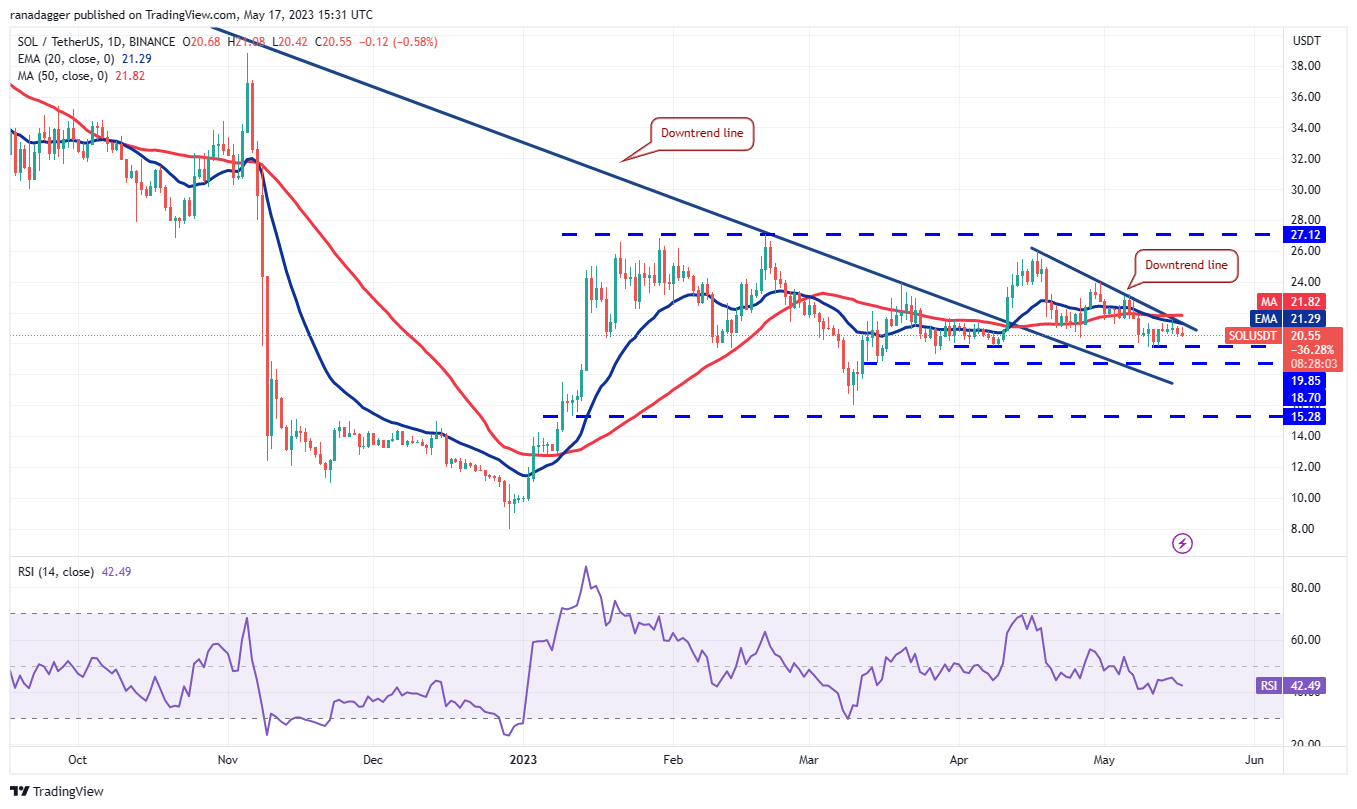
The price remains stuck between the downtrend line and the horizontal support at $19.85, but this tight-range trading is unlikely to continue for long. The bears will try to tug the price below $19.85 and challenge the support at $18.70.
On the other hand, the bulls will try to propel and sustain the price above the 50-day SMA ($21.83) to signal the start of a sustained recovery. The SOL/USDT pair could then rally to $24 and subsequently to $26.
Polkadot price analysis
Polkadot (DOT) has been consolidating near the crucial support of $5.15 for the past few days. The failure to start a strong rebound suggests a lack of aggressive buying at current levels.
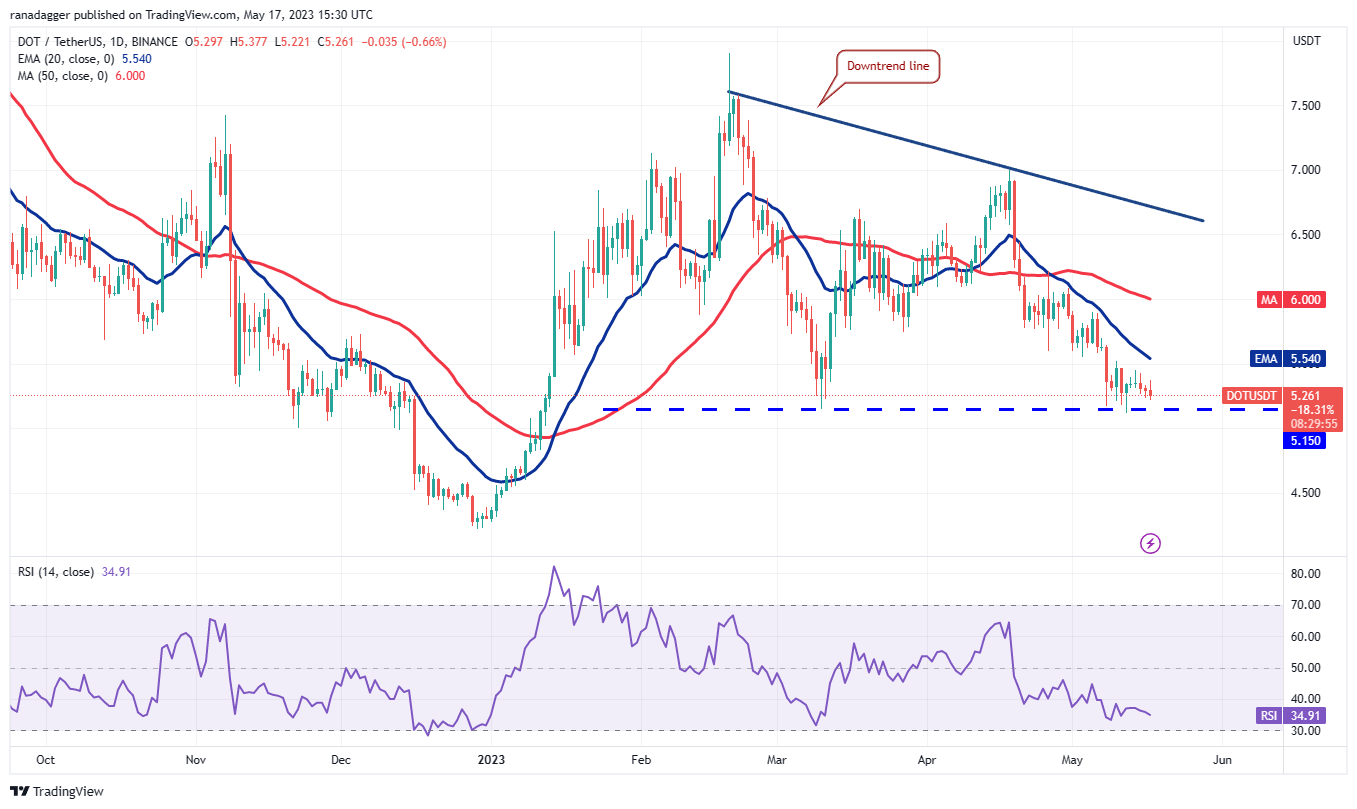
The downsloping 20-day EMA ($5.54) and the RSI in the negative zone suggest that bears are in command. If the $5.15 support cracks, the selling could pick up momentum and the DOT/USDT pair may slide to $4.50 and then to $4.22.
Buyers will have to propel the price above the 20-day EMA to indicate a comeback. The pair may then rise to the 50-day SMA ($6) and later attempt a rally to the downtrend line. A break above this resistance will signal that the tide has turned in the favor of the bulls.
Litecoin price analysis
Litecoin (LTC) broke above the 20-day EMA ($85) on May 15 and followed that up with another up move above the 50-day SMA ($89) on May 16.
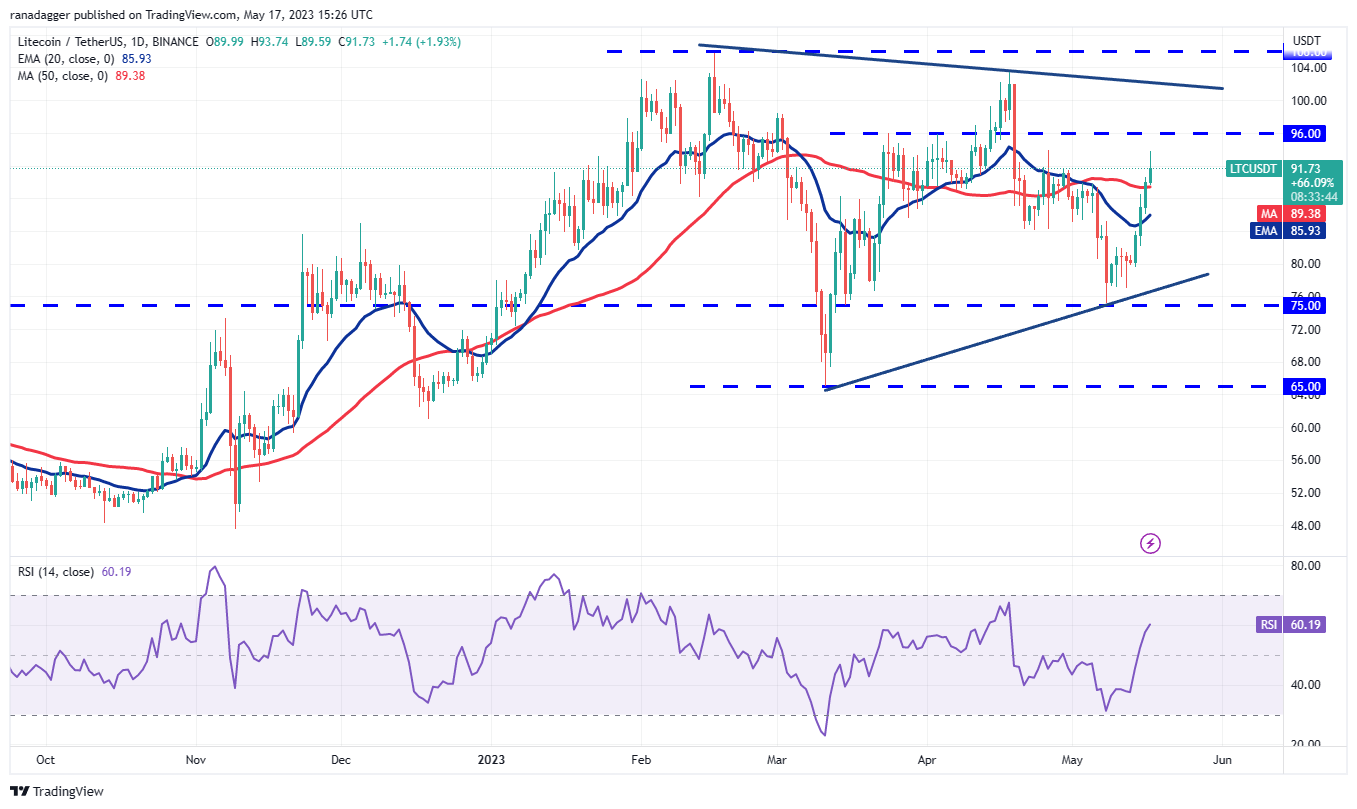
The LTC/USDT pair is nearing $96, where the bears are expected to mount a strong defense. If the bulls do not give up much ground from this level, the likelihood of a break above $96 increases. The pair could then retest the overhead level at $106.
Instead, if the price turns down sharply from $96 and breaks below the moving averages, it will indicate that bears are holding their ground. The pair may then swing between $75 and $96 for a few more days.
This article does not contain investment advice or recommendations. Every investment and trading move involves risk, and readers should conduct their own research when making a decision.
This article is for general information purposes and is not intended to be and should not be taken as legal or investment advice. The views, thoughts, and opinions expressed here are the author’s alone and do not necessarily reflect or represent the views and opinions of Cointelegraph.
