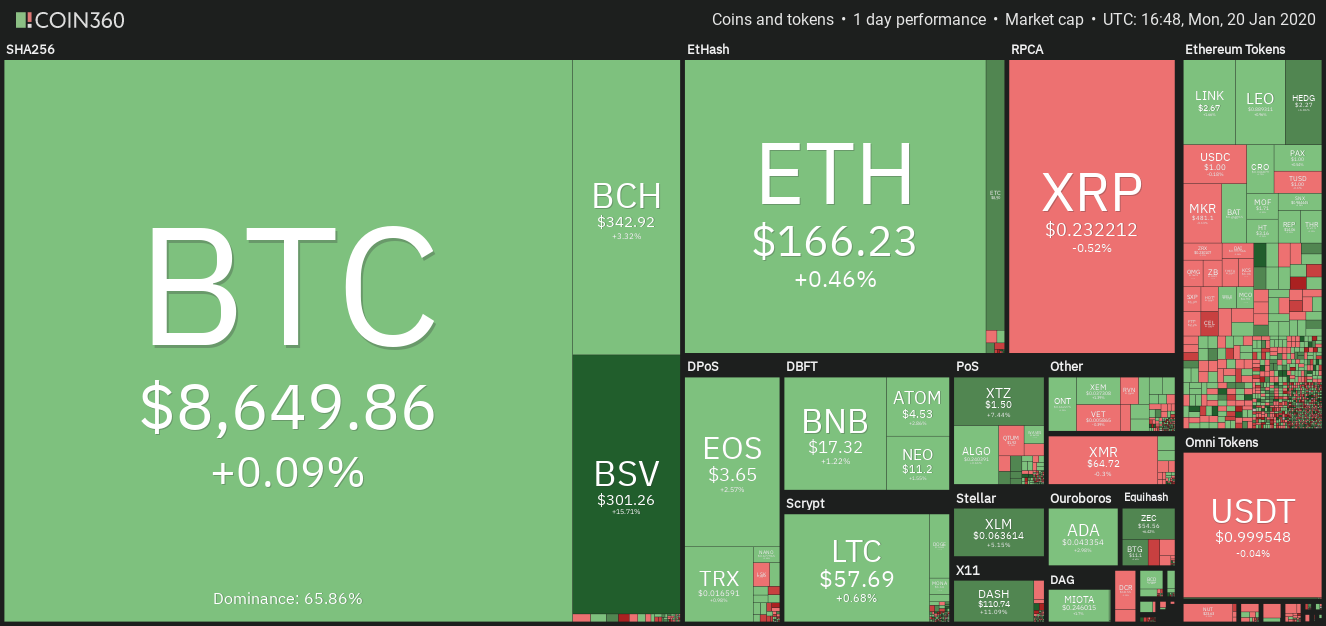
The correction in most major cryptocurrencies is shallow, which suggests that the up move is likely to continue within the next few days.
The total market capitalization of the crypto space rallied from about $184 billion on Jan. 3 to a high of $250 billion on Jan. 19. That is a 35% gain within a short span of time. Usually, fast-paced rallies do not last long, hence, for the long-term health of the markets, it is better to have rallies with intermittent corrections.
Bitcoin has been following the Stock-to-Flow model fairly accurately. The model’s creator, an analyst known as PlanB, believes that the price of Bitcoin is likely to average around $8,200 until the halving event in May of this year. Thereafter, the model projects the price to shoot up to about $100,000 within two years. While the target is extremely bullish, only time will tell whether Bitcoin reaches there or not.
Daily cryptocurrency market performance. Source: Coin360
Australian micro-investment startup Raiz has received clearance from the Australian Securities and Investment Commission, the country’s financial watchdog agency, to offer Bitcoin fund services to its users. The proposed Bitcoin retail fund is likely to launch in the first half of this year and it will have 5% exposure to Bitcoin directly, with the rest being invested in exchange traded funds. Though the crypto portion is small, we like the way, the regulators are gradually opening up to Bitcoin.
The crypto markets have currently entered a corrective phase. Let’s look at the critical levels to watch on the downside that can provide support.
BTC/USD
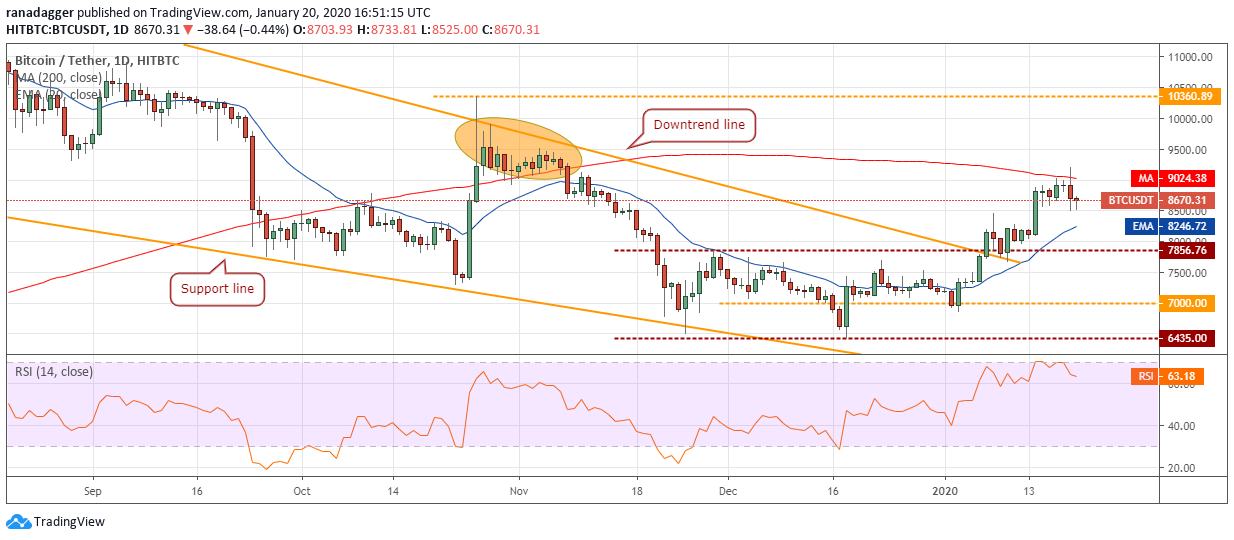
The bulls scaled above the 200-day SMA at $9,036 on Jan. 19 but could not hold on to the gains. The price quickly turned down and Bitcoin (BTC) formed an outside day candlestick pattern, which suggests that bears are active at higher levels.
BTC USD daily chart. Source: Tradingview
The price can now dip to the 20-day EMA at $8,247, which is likely to act as a strong support. The upsloping 20-day EMA and the RSI in the positive territory suggest that bulls are in command.
If the price bounces off sharply from the 20-day EMA, the bulls will again attempt to carry the BTC/USD pair above the 200-day SMA. If successful, a rally to $10,360.89 will be on the cards.
Contrary to our assumption, if the bears sink the price below the 20-day EMA, a drop to $7,856.76 is possible. This is an important level to watch out for because if it breaks down, the next support is at $7,000. For now, the traders can retain the stop loss on their long positions at $7,600.
ETH/USD
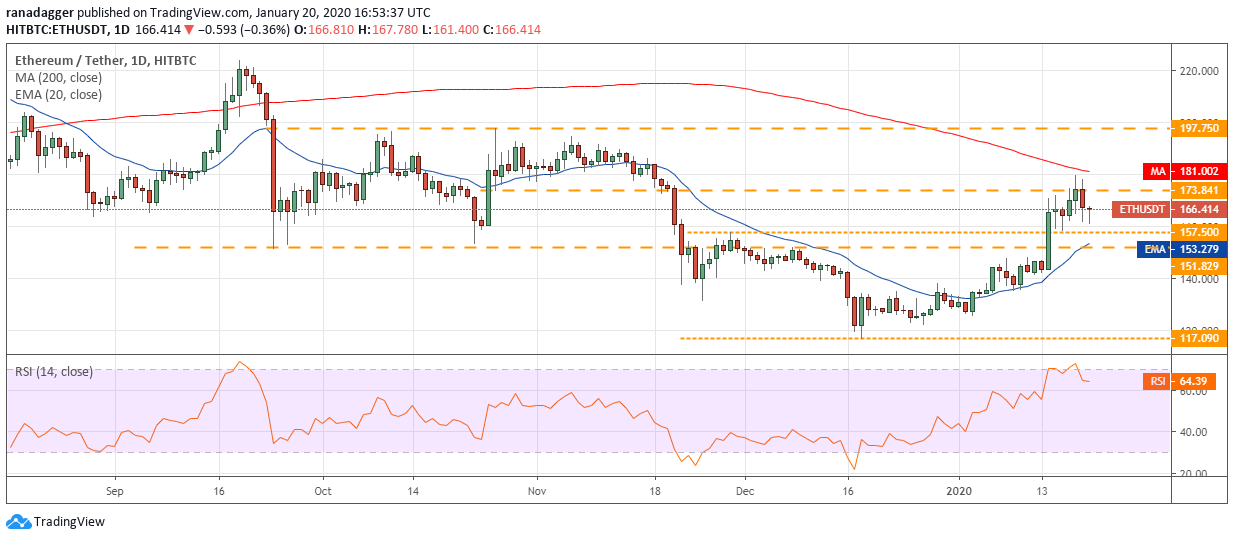
Ether (ETH) broke above the overhead resistance at $173.841 on Jan. 18 and 19 but could not scale above the 200-day SMA at $182. This shows that the bears are aggressively defending the 200-day SMA.
ETH USD daily chart. Source: Tradingview
The price turned down sharply on Jan. 19 but found support closer to $157.50. This shows that bulls are using the dips to accumulate.
With buyers emerging close to $157.50 and sellers near the 200-day SMA, the possibility of a range-bound action for the next few days increases. A break above the 200-day SMA can carry the ETH/USD pair to $197.75 while a break below $157.50 can sink the price to the 20-day EMA at $153.
The pair will turn negative on a break below $151.829. Therefore, traders can retain the stop loss on the remaining long positions at $150.
XRP/USD
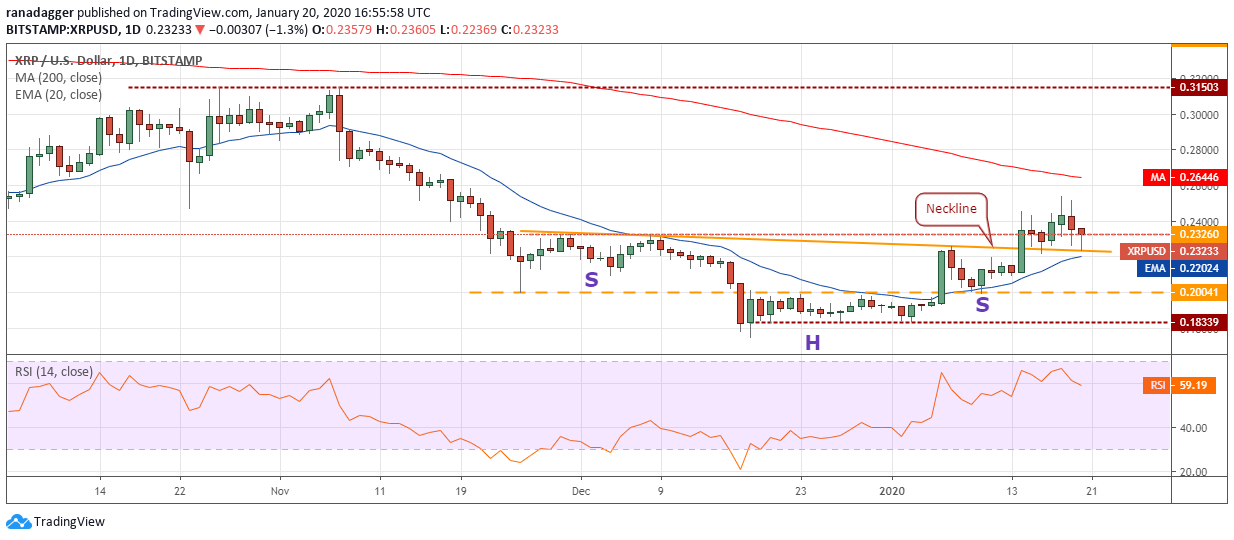
XRP could not pick up momentum after breaking out of the neckline of the inverted head and shoulders (H&S) pattern. The altcoin turned down from $0.25401, which shows a lack of demand at higher levels.
XRP USD daily chart. Source: Tradingview
The XRP/USD pair has bounced off the neckline of the bullish setup, which suggests that bulls are using the dips to accumulate. The 20-day EMA is placed just below the neckline, hence, this level is likely to act as a strong support. If the bulls can carry the price above the 200-day SMA, a move to $0.31503 is possible.
Conversely, if the bears sink the price below the 20-day EMA, a drop to $0.20041 is possible. For now, the traders can keep the stop loss on the long positions at $0.1995.
BCH/USD
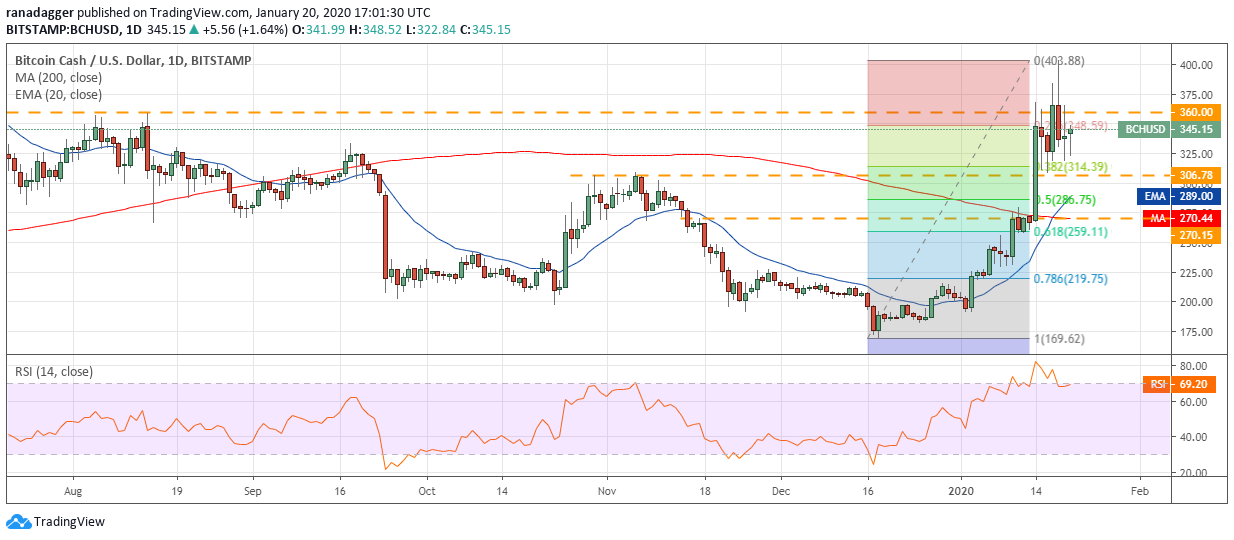
Bitcoin Cash (BCH) rallied above the overhead resistance at $360 on Jan. 17. The bulls again pushed the price higher on Jan. 18 but could not reach our target objective of $423.40. The price turned down from $403.88.
BCH USD daily chart. Source: Tradingview
The reversal on Jan. 18 dragged the price back below $360, which shows aggressive selling at higher levels. Currently, the price is stuck between $306.78 and $360.
If the bulls can push the price back above $360 a retest of $403.88 and above it $423.40 is possible. On the other hand, a break below $306.78 can drag the price to $270.15.
In our previous analysis, we had suggested traders trail the stops on the remaining long positions higher after the price broke above $360. We anticipate the trailing stops have been hit. The traders can wait for a new buy setup to form before initiating long positions again.
BSV/USD
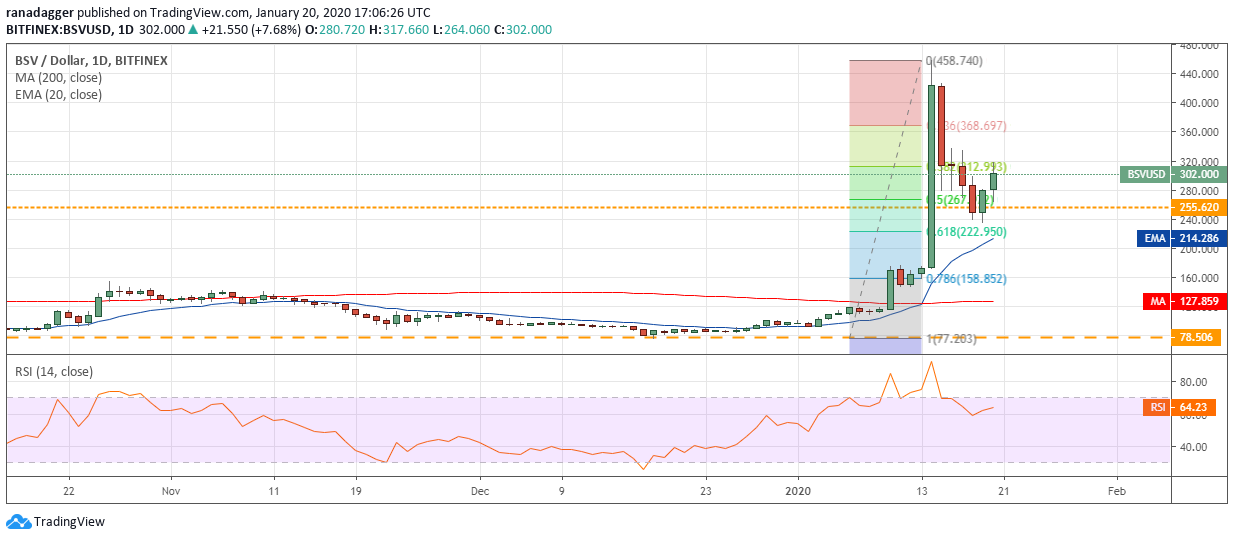
Bitcoin SV (BSV) dipped below $255.62 on Jan. 18 but found support at $236, which is just above the 61.8% Fibonacci retracement level of the rally from $77.203 to $458.74. The bulls are currently attempting to resume the up move.
BSV USD daily chart. Source: Tradingview
We anticipate the BSV/USD pair to hit a roadblock close to $335. If the price turns down from this level, the pair is likely to consolidate for a few days before making its next directional move.
Our view will be invalidated if the price turns down from the current levels or the overhead resistance and dips below the 20-day EMA at $214. As we expect a range-bound action for the next few days, we suggest traders remain on the sidelines.
LTC/USD
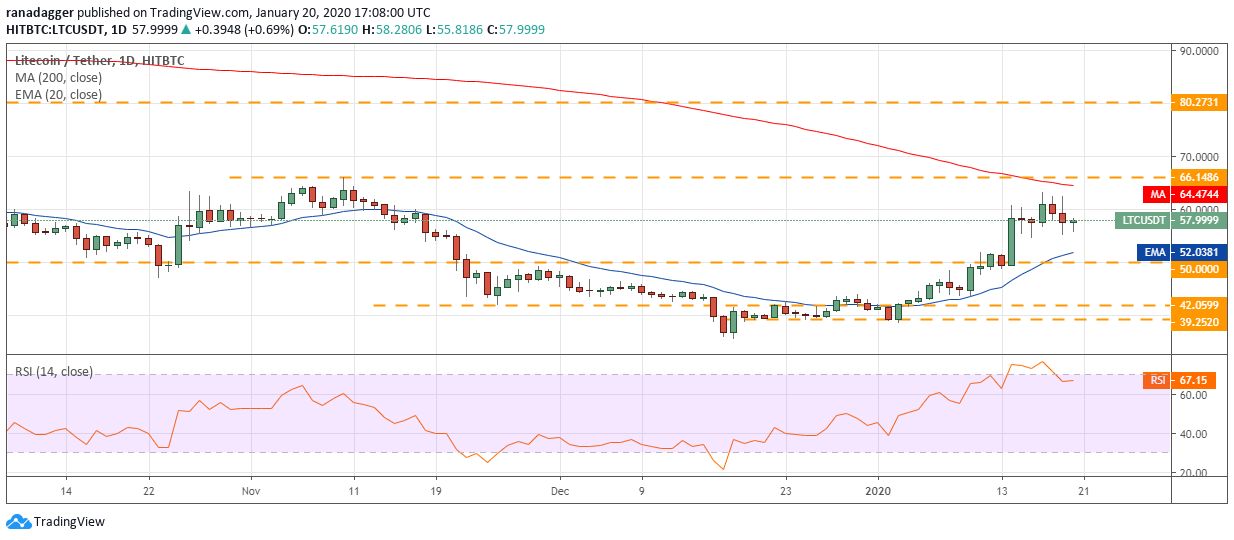
Though Litecoin (LTC) rose above $60 on Jan. 17, 18 and 19, the bulls could not scale above the 200-day SMA and reach $66.2486. This shows that the bears are aggressively defending the 200-day SMA.
LTC USD daily chart. Source: Tradingview
The price can now dip to the 20-day EMA, which is likely to act as a strong support. A strong bounce off the 20-day EMA can carry the price to the 200-day SMA once again. If the bulls can scale above the 200-day SMA and $66.1486, a move to $80.2731 will be on the cards.
Our view will be invalidated if the bears sink the LTC/USD pair below the 20-day EMA and the support at $50. A break below $50 will be a huge negative.
EOS/USD
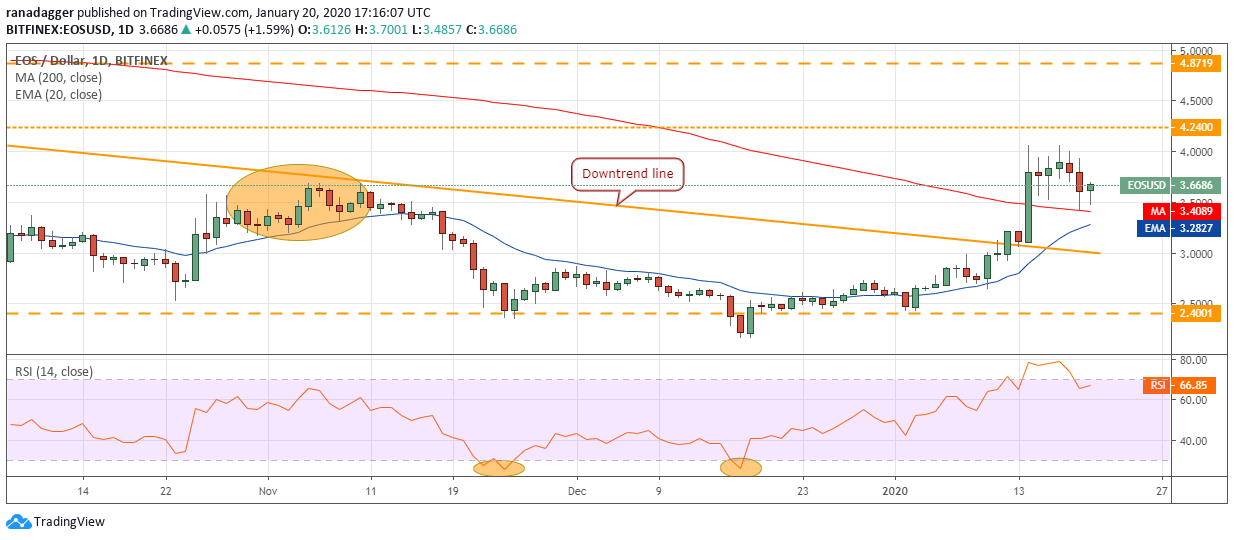
EOS turned down from $4.0623 on Jan. 17 but found support at the 200-day SMA at $3.42 on Jan. 19. This is a positive sign as it shows that bulls are buying on dips. The bulls are currently attempting to resume the up move.
EOS USD daily chart. Source: Tradingview
If the bulls can build up on the current bounce, we expect another attempt to scale above $4.24. If successful, a move to $4.8710 will be on the cards.
On the other hand, if the rebound attempt fizzles out, the EOS/USD pair can dip to the 200-day SMA once again. Below this level, a drop to $3 is possible. Therefore, the traders can retain their stops on the remaining long positions at $3.4.
BNB/USD
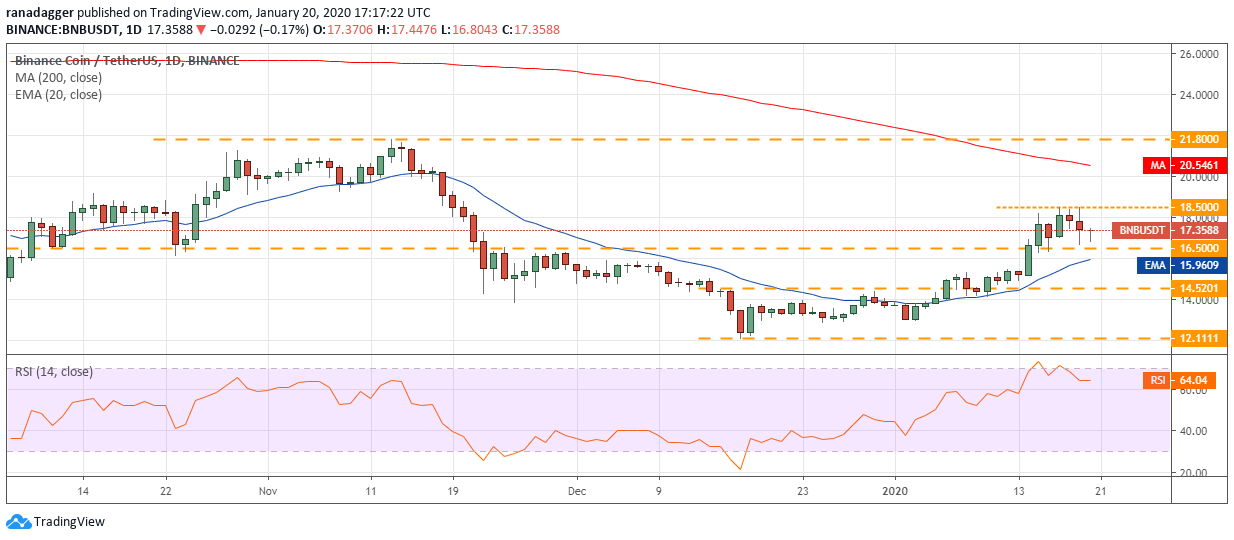
Binance Coin (BNB) is currently range-bound between $16.50 and $18.50. The bears defended the $18.50 levels aggressively between Jan. 17 and 19. Subsequently, the bulls purchased the dip to the strong support at $16.50 on Jan. 19.
BNB USD daily chart. Source: Tradingview
This suggests that the price might consolidate between $16.50 and $18.50 for a few more days. A break above $18.50 can carry the price to the 200-day SMA and above it to $21.80.
On the other hand, a break below $16.50 and the 20-day EMA at $15.94 can sink the price to $14.5201. Therefore, traders can keep the stop loss on the long positions at $15.90.
XLM/USD
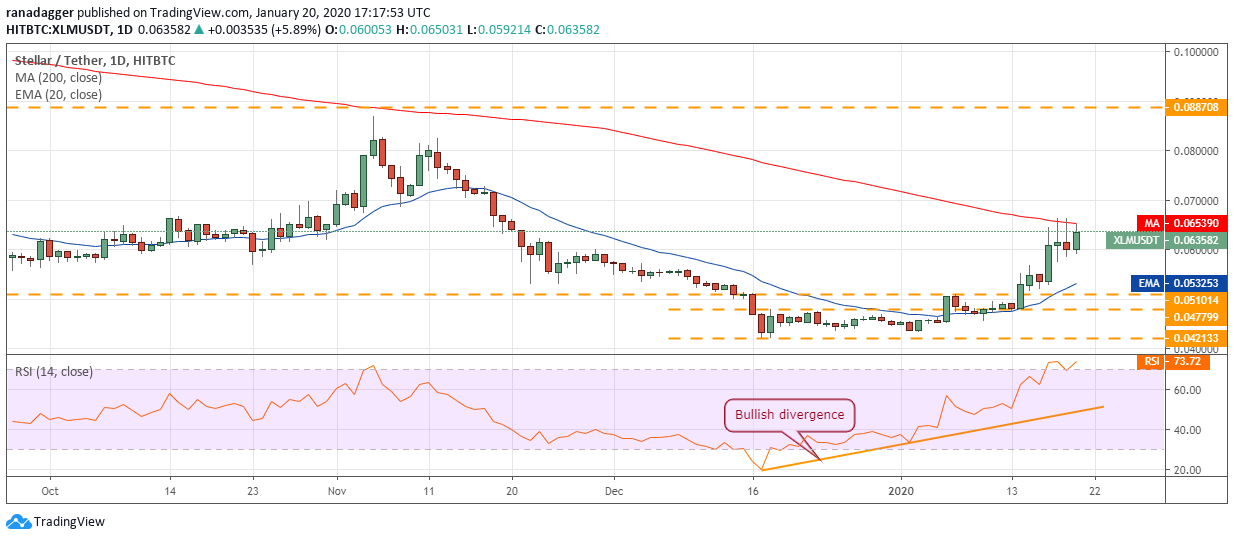
Stellar Lumens (XLM) has again found a place in the top ten list. For the past two days, the bulls failed in their attempts to push the price above the 200-day SMA. However, the positive thing is that the altcoin has not given up much ground, which shows buying on dips.
XLM USD daily chart. Source: Tradingview
If the bulls can propel the price above the 200-day SMA, the XLM/USD pair is likely to extend its up move to $0.088708. The traders who had purchased on our earlier recommendation can keep the stops on their long positions at $0.056.
If the bulls fail to push the price above the 200-day SMA, the bears will attempt to sink the price to the 20-day EMA, which is likely to act as a strong support. The pair will turn negative on a break below $0.051014.
ADA/USD
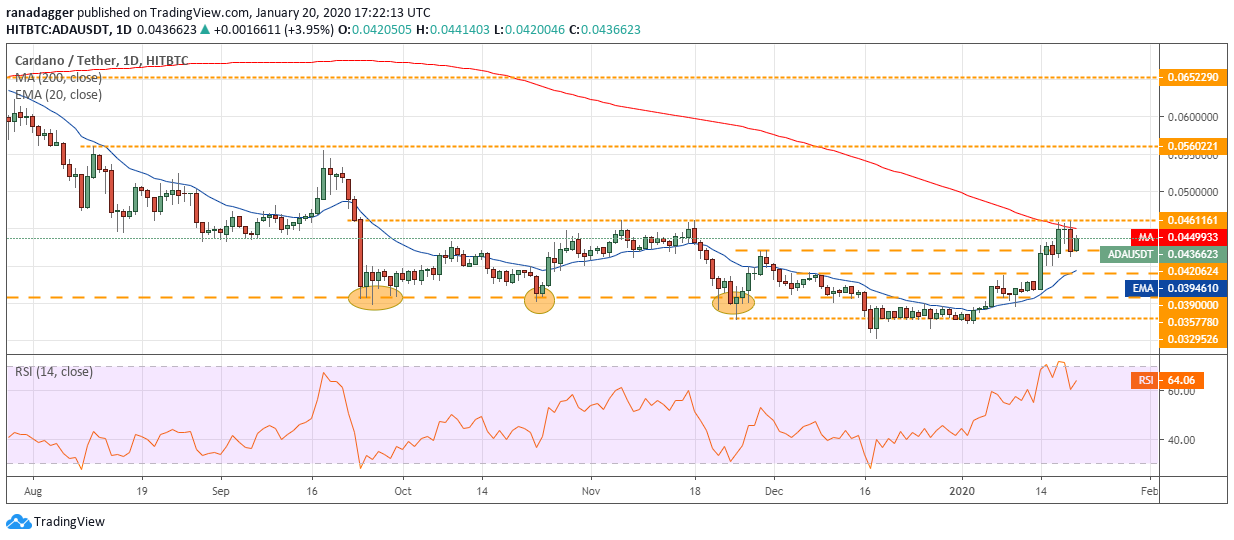
Cardano (ADA) is the other new entrant in the list. The bears are aggressively defending the overhead resistance at $0.0461161. The 200-day SMA is also placed just below this level, hence, this is an important level to watch out for. If the bulls can scale the price above $0.0461161, the altcoin is likely to pick up momentum.
ADA USD daily chart. Source: Tradingview
On a break above $0.0461161, the ADA/USD pair can rally to $0.0560221. With the 20-day EMA sloping up and the RSI in positive territory, the advantage is with the bulls. The traders can wait for the price to close (UTC time) above $0.0461161 before initiating long positions. The initial stop loss can be placed just below the 20-day EMA at $0.039.
Our bullish view will be invalidated if the price turns down from the current levels or the overhead resistance and breaks below the 20-day EMA.
The views and opinions expressed here are solely those of the author and do not necessarily reflect the views of Cointelegraph. Every investment and trading move involves risk. You should conduct your own research when making a decision.
Market data is provided by HitBTC exchange.

