
Crypto analyst Jacob Canfield has laid out a comprehensive analysis, suggesting Solana (SOL) could be on the brink of an unprecedented market surge. “In my opinion, I think that Solana is going to continue to be one of the biggest movers during this current bull market cycle,” Canfield states, proposing that Solana could potentially escalate its market dominance to the 12-15% range.
Can Solana Hit $1,000?
Canfield bases his analysis on several indicators. He highlights the Solana Dominance (SOL.D) chart, noting that at the peak market cap, it didn’t even crack 3%. Given the current trends and the breakout of SOLBTC from its weekly resistance, Canfield envisions a scenario where Solana could enter a parabolic rally phase, which is further supported by the SOLETH chart showing a similar pattern. “SOLETH – Also currently broke out of a weekly resistance and looks to be forming a parabolic rally against it.”
A significant factor in Canfield’s analysis is the current state of Ethereum Dominance (ETH.D). He notes that ETH.D is breaking down from a long-term trendline and losing the 200 weekly moving average, now sitting at 17%. “If Solana continues to trend against Ethereum and it continues to break down to 2019-2020 levels, we could see SOL as the big winner this cycle,” Canfield explains.
However, Canfield does not disregard the potential ramifications of recent news regarding an Ethereum ETF. “This may not play out with the current ETF announcement news as it will bring more attention,” he acknowledges, indicating that an approved Ethereum ETF could shift investor focus and capital back to Ethereum, potentially tempering Solana’s ascent.
Despite potential headwinds from the Ethereum sector, Canfield emphasizes Solana’s robust partnerships with corporate giants like Google, Circle, and Amazon, positing that these collaborations could significantly drive adoption and enhance Solana’s visibility in this cycle of the crypto market.
Furthermore, Canfield’s analysis extends beyond charts and partnerships. He delves into the Solana ecosystem, spotlighting projects that are paving the way for its expansion. From decentralized finance protocols and automated market makers to NFT storage solutions and governance tokens for gaming platforms, Canfield points to a breadth of innovation within Solana that parallels, and in some aspects, seeks to outdo Ethereum’s ecosystem.
In light of the FTX debacle, Canfield remarks on the psychological impact on Solana’s market sentiment, noting that with Sam Bankman-Fried’s legal troubles, there is an opportunity for Solana to redefine itself. “There’s a bit of PTSD around the ecosystem, but it’s time to become its own entity and forge its own future,” he asserts, suggesting that Solana’s future will be shaped by those who are deeply integrated into its ecosystem, from developers to traders and influencers.
His conclusion: “Solana could triple or quadruple it’s all time high market dominance around 12-15% and if it continues to trend against Bitcoin, could easily see a $1,000 per coin and take the #2 spot behind Bitcoin.” When asked about the potential of Ethereum, Canfield emphasized, “No reason to not have allocations to both. It’s like trying to bet on Microsoft or Google. Tesla or Ford: Just buy both.”
Short-Term SOL Price Outlook
On the shorter-term horizon, analyst Rekt Capital brings attention to Solana’s price movements in a recent post on X. “Solana continues to outperform in the market. In 2021, SOL upside deviated to $53 and then $61 before retracing to the bottom of the purple box,” he noted, referring to a specific zone on the price chart that has historically acted as both resistance and support.
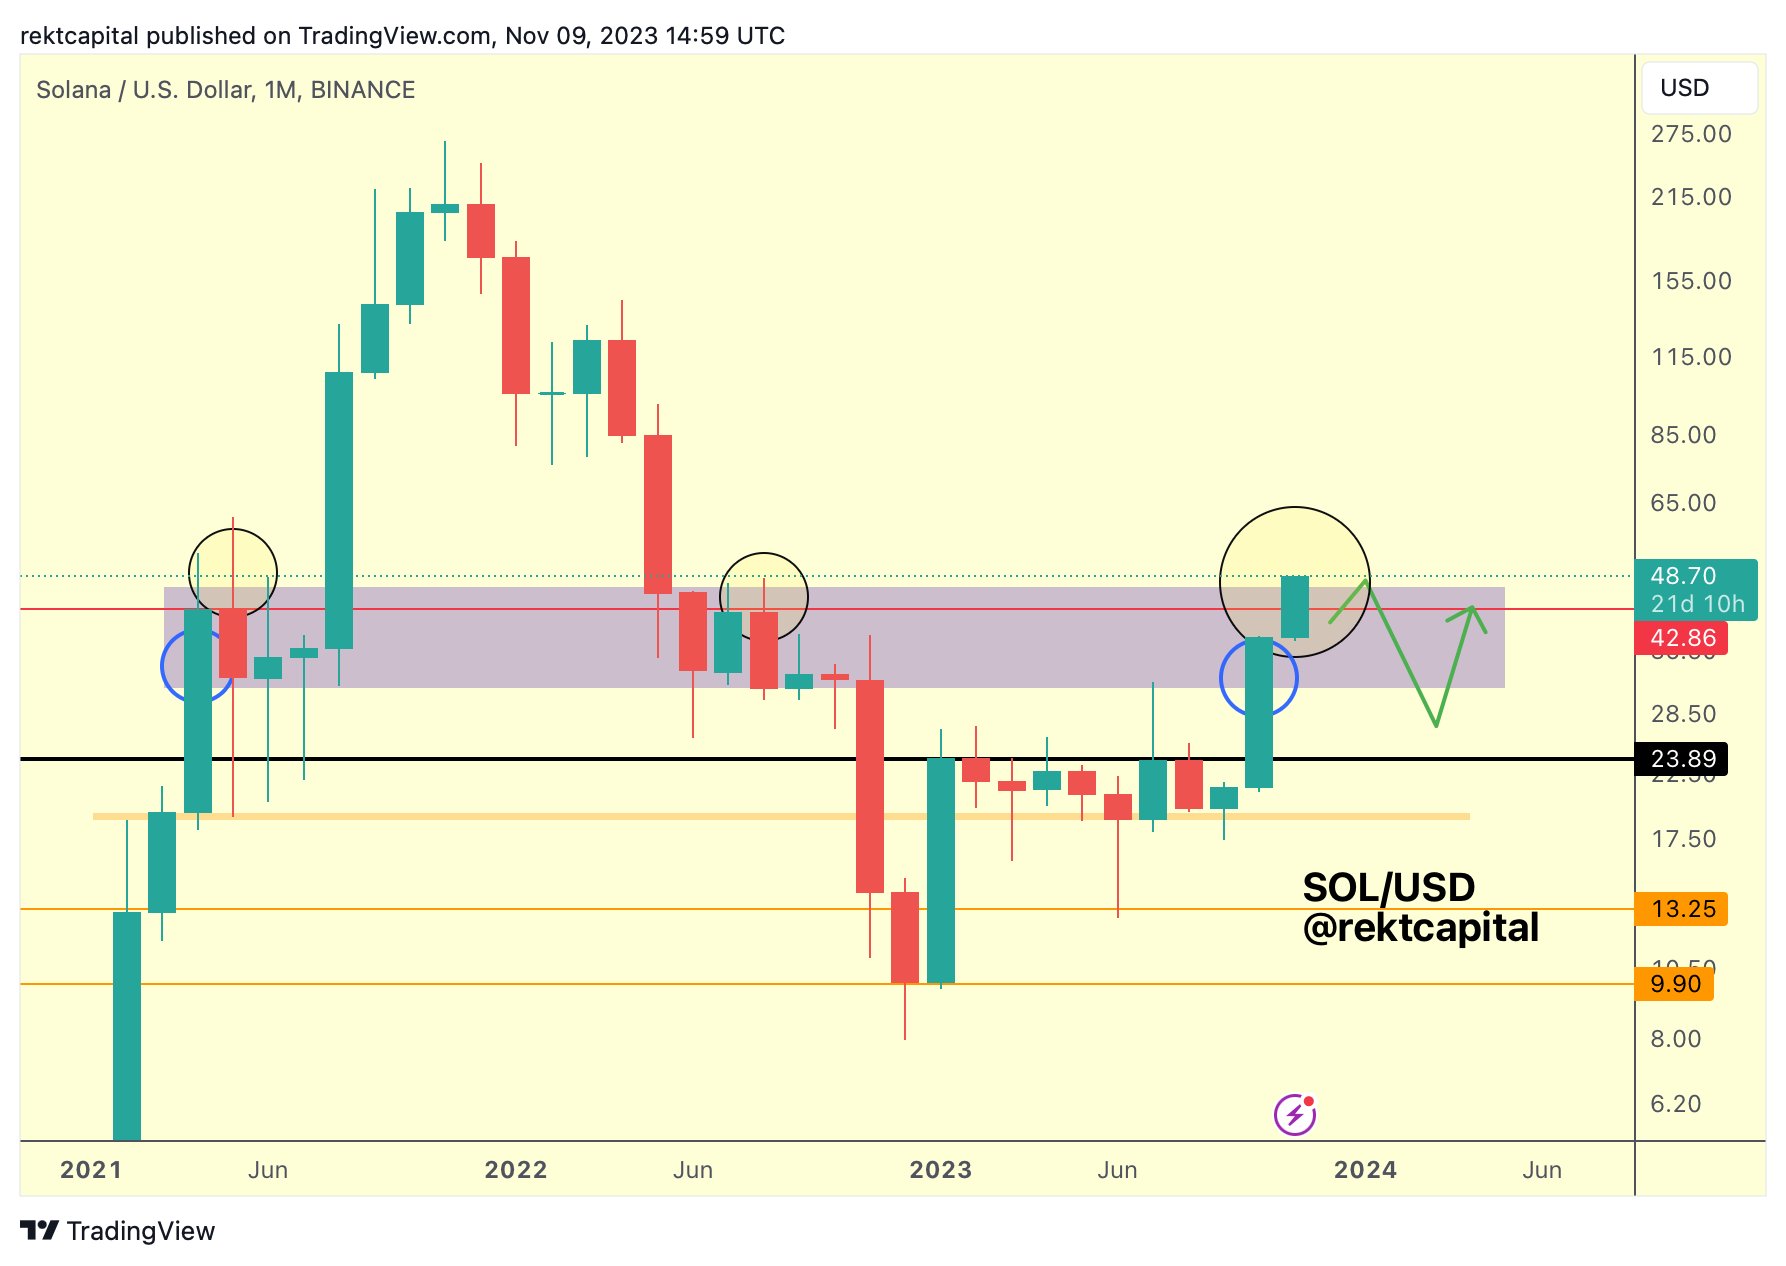
In the Rekt Capital chart, SOL is currently breaking out above the zone. However, if history repeats itself and the zone once again acts as strong resistance, the SOL price could suffer a severe pullback. Using the green arrow in the chart, Rekt Capital paints a scenario in which SOL initially falls back towards $30 before the price rises again towards $42.
Featured image from ABCC Exchange, chart from TradingView.com


