Solana depreciated by almost 6% over the last 24 hours as the broader market started to get choppy. Bitcoin was seen trading below the $40,000 mark while Ethereum broke the support level of $3,000.
The global market currency cap stood at $1.94 Trillion after a fall of 6% over the past day.
Solana had depicted considerable recovery on charts as it broke subsequent price ceilings over the past week.
The coin had managed to revisit the $110 level which the coin hovered near thrice in the past week or so. Following the recent dip, buyers decided to exit the market as the coin witnessed a sell-off as seen on the four-hour chart.
Solana Price Analysis: Four Hour Chart
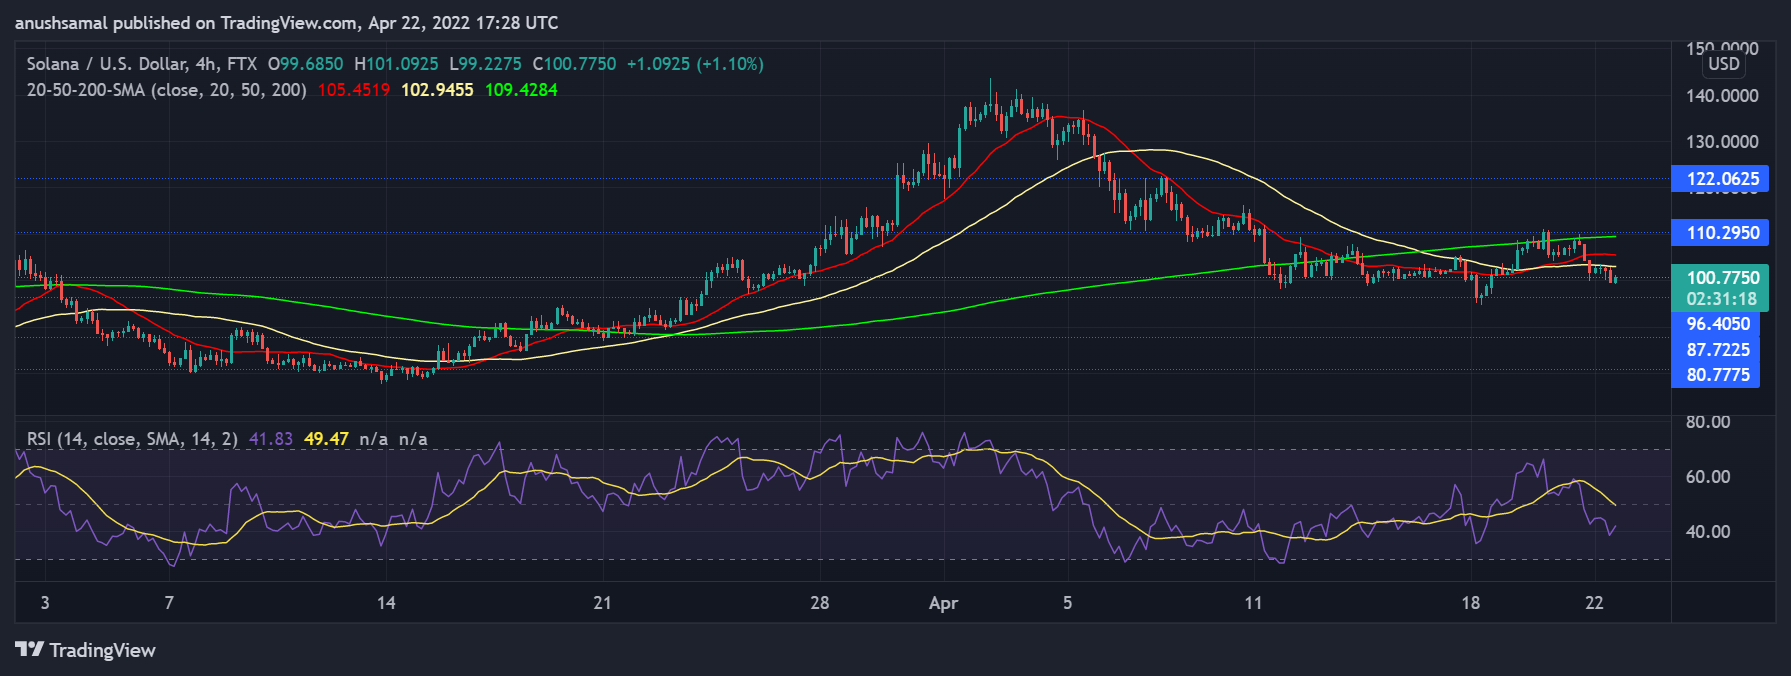
Solana was priced at $100 at the time of writing. The altcoin lost close to 6% of its value over the last 24 hours. SOL had noted a sharp recovery on the 18th of April and it challenged its resistance mark of $110.
At press time, SOL was aiming for its nearest support level of $96. The coin was trading in a descending trendline, which signifies that SOL could continue in its downward trajectory. From the four-hour chart, it signalled that Solana was undergoing a price correction.
If the bears continue to exert dominance, Solana would immediately fall by 4%. A fall from the $96 price level would push prices to $87 and then finally undergo a depreciation of 18% and land at $80.
Trading volume had dipped but was in the green, which could also mean that buying pressure was increasing at the time of writing.
Related Reading | Is Bitcoin Gonna See Another Big Drop Soon? Historical Trend May Say Yes
Technical Analysis

Solana had experienced a bout of buying pressure when the coin soared on April 18th. At the time of writing, the coin witnessed a surplus of sellers.
On the Relative Strength Index, the indicator was seen below the the half-line which is indicative of increased selling strength, however there was a slight uptick on the RSI. This uptick could mean that buying strength would pick up over the next trading sessions.
On the 20-SMA, SOL was placed underneath the 20-SMA line. This referred to sellers driving the price momentum in the market.

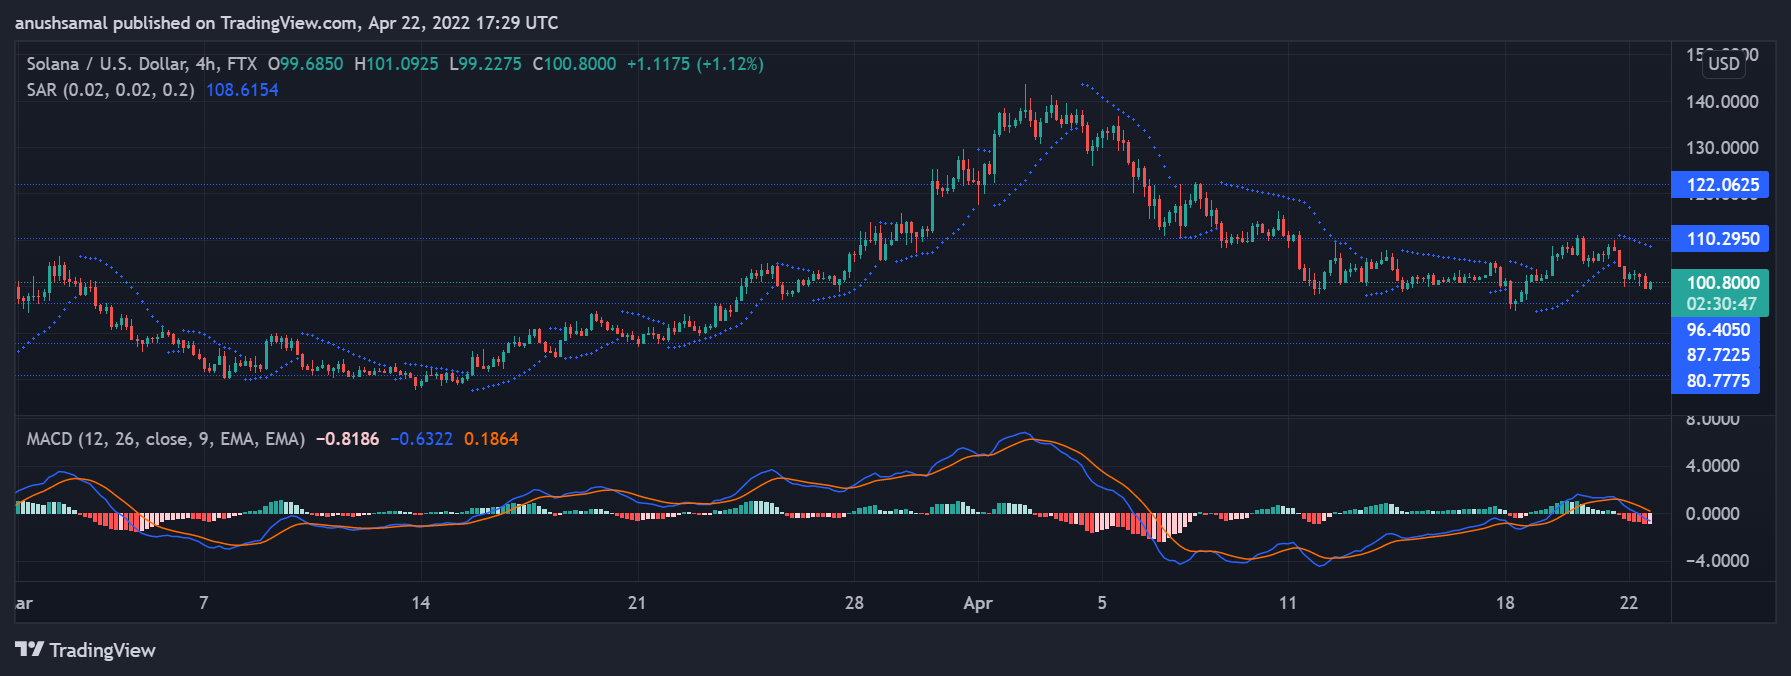
Solana was on a continued price correction as seen from the above chart. MACD which is responsible for determining the market momentum indicated bearishness in the market. On the aforementioned indicator, the coin displayed a bearish crossover at the time of writing.
It also displayed small red histograms which signified that SOL would continue on a negative price action. Investing in Solana at the moment doesn’t seem to be a wise decision. For the coin to see some respite, it had to break above the $110 price mark and trade over it for a considerable period of time.
The Parabolic SAR which determines a stop-loss order, has demonstrated dotted lines above the price candlesticks which is synonymous to a negative price movement.
Related Reading | Bitcoin Under Pressure Near $40K, Here Are 2 Reasons Why That Could Change Soon
Featured image from Unsplash.com, charts from TradingView.com


