Major Bitcoin Metric Breaks 3-Month Downtrend Amid Bullish Network Recovery

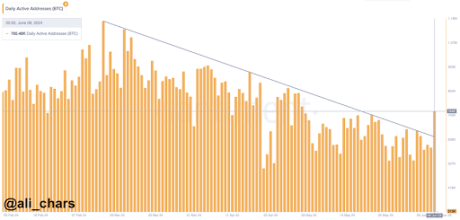
The Bitcoin on-chain metrics continue to show bullish signs that a parabolic breakout is imminent for the flagship crypto. The latest of these metrics is a significant turnaround in Bitcoin’s network activity, which could further provide bullish momentum for the crypto token.  Bitcoin Sees Surge In Network Activity  Crypto analyst Ali Martinez revealed in an X (formerly Twitter) post that the number of daily Bitcoin addresses had broken a downtrend that began on March 5. He added that 756,480 Bitcoin addresses have been active in the last 24 hours. Martinez…

Polkadot (DOT) Forms Rising Wedge Pattern, Bullish Or Bearish?

Polkadot (DOT), a popular cryptocurrency in the blockchain space, has been making waves with its innovative approach to interoperability and scalability. However, like any financial asset, its price movement is subject to various technical analysis patterns, one of which is the rising wedge chart pattern. The formation of a rising wedge pattern on DOT’s price chart suggests that despite its recent upward trajectory, there could be a downturn on the horizon. Traders and investors often watch for confirmation signals such as a break below the lower base of the wedge…

Injective (INJ) Price Set To Skyrocket 33% On Bullish Signal

In an analysis shared on X, renowned crypto analyst Josh Olszewicz (@CarpeNoctom) forecasts a significant 33% rise in the price of Injective (INJ) based on a classic bullish chart pattern known as the inverted head and shoulders (iH&S). The chart suggests a strong reversal possibility from recent bearish trends, potentially steering the cryptocurrency’s price to new local highs. Injective Price Prepares For Lift-Off The iH&S pattern, prominently featured in Olszewicz’s chart, is a revered formation among technical analysts for predicting bullish reversals following a downward trend. This pattern is identified…

Robert Kiyosaki Says His Prediction of Bitcoin Hitting $350K in August ‘Is Not a Lie’ — Also Bullish on Ethereum and Solana

Rich Dad Poor Dad author Robert Kiyosaki has emphasized that his prediction of bitcoin hitting $350K on Aug. 25 “is not a lie.” He also expressed his bullish outlook for ethereum and solana, noting that he will keep buying the three cryptocurrencies because he is “quite certain their prices will continue to rise.” Robert Kiyosaki […] Original

Solana (SOL) Maintains Bullish Trajectory Above 100-Day SMA, Rally Looms?

Solana (SOL) has shown remarkable market resilience by holding onto its position above the 100-day Simple Moving Average (SMA) in spite of notable market turbulence. SOL has seen a lot of volatility in the last several months, but it has found firm support at this pivotal moving average, indicating a persistent positive mood. The ability of Solana to hold above the 100-day SMA shows that buying enthusiasm outweighs any downward pressure, providing a good basis for future upward momentum thereby attracting the attention of traders and investors. As of the…

AVAX Primed To Break $100 Barrier As Bullish Signs Emerge

Avalanche (AVAX), the token powering the smart contracts platform Avalanche, is stirring excitement in the crypto sphere. Bullish technical indicators and upcoming developments within the Avalanche ecosystem are fueling speculation of a significant price surge, with some analysts eyeing a potential rally above $100. Related Reading Technicals Flash Green: A Bounce In Sight? Technical analysis based on historical data and chart patterns paints a promising picture for AVAX. Analysts point to a recent corrective phase that the token appears to have overcome, potentially setting the stage for a new uptrend.…

Steady Ascent Points to Bullish Momentum

Bitcoin price started a decent increase above the $70,500 resistance. BTC is showing positive signs and might gain bullish momentum above the $72,000 resistance in the near term. Bitcoin extended its increase above the $70,000 and $70,500 resistance levels. The price is trading above $70,000 and the 100 hourly Simple moving average. There is a key bullish trend line forming with support at $70,600 on the hourly chart of the BTC/USD pair (data feed from Kraken). The pair could gain bullish momentum if it settles above the $72,000 level. Bitcoin…

Analysts Bullish on Bitcoin: QCP Capital Foresees New All-Time Highs in June

Singapore-based QCP Capital indicates that bitcoin could potentially exceed its all-time high of $73,794 this month by crossing the $74,000 threshold. The signals QCP emphasized were derived from bitcoin call options with June expiries. Several Market Observers See Bullish Bitcoin Momentum Ahead Several analysts and researchers have a positive outlook on bitcoin’s prices for June. […] Original

Bitcoin is on the verge of a bullish breakout again. What to watch on the charts

At the time of my January article , bitcoin was trading near $45k, and there were rumors circulating about the SEC finally approving an ETF. That became a reality the very next day. Let’s revisit the chart now. Our price target back then was $66.5k, which was near the former all-time highs. That has since been hit, but in classic crypto fashion, BTC first fell back to $38.5k by the end of January before bottoming. Despite the wild ride from a performance and volatility perspective, over the last six months, BTC…

Calm Before A 500% Bullish Storm?

Bitcoin price is back trading above $70,000 after weeks of sideways price action. The recent boredom and sideways grind, however, isn’t necessarily a bad thing. In the past, such lulls in volatility have preceded the top cryptocurrency’s greatest rallies on record. Let’s take a look. Bitcoin Historical Volatility Reaches Record Low The term volatility often has a negative connotation surrounding it. For example, Oxford Languages defines volatility as the “liability to change rapidly and unpredictably, especially for the worse.” In financial markets, the term refers to how much and how…