
Key takeaways:
-
Bitcoin’s entity-adjusted dormancy flow dropped below 250,000, a historical buy zone.
-
The short-term holder NUPL turned negative, indicating seller exhaustion.
-
Bitcoin’s V-shaped and double-bottom chart patterns suggest a potential rise to $118,000-$124,500 in the short term.
Bitcoin (BTC) price traded 5% above its local low of $108,650, with three indicators suggesting that this level may have marked the local bottom for BTC.
Entity-adjusted dormancy hints at BTC bottom
One metric that can be used to determine whether the Bitcoin market has bottomed out is the entity-adjusted dormancy flow, which represents the ratio of BTC’s current market capitalization and the annualized dormancy value (measured in US dollars).
Related: Bitcoin bulls are back: Here’s what is needed for a rally to $120K
Historically, a drop in the indicator below 250,000 (red circles) presents a “good historical buy zone” and has often preceded significant price recoveries or marked the end of price corrections. The indicator dropped to a low of 133,300 on Thursday.
Historically, breakouts above 250,000 after a previous dip have coincided with the beginning of significant bull runs. One instance is when Bitcoin bottomed out in July 2021 and began a new bull run, with the metric falling into the green zone. Bitcoin went on to hit a record high of $69,000 on Nov. 10.
With the indicator sending a bullish signal again, the price could rise from the current levels around $114,000 to test all-time highs in the near term.
As Cointelegraph reported, Bitcoin’s spent output profit ratio (SOPR) has also dropped to 1.5, a zone that has historically aligned with local bottoms.
Bitcoin’s STH net unrealized profit/loss flips negative
Bitcoin’s short-term holder Net Unrealized Profit/Loss (NUPL) has flipped negative, signaling stress among recent buyers, those holding BTC for less than 155 days.
“STH capitulation events have historically marked periods of market reset, often laying groundwork for renewed accumulation,” said onchain data provider Glassnode in an X post on Monday.
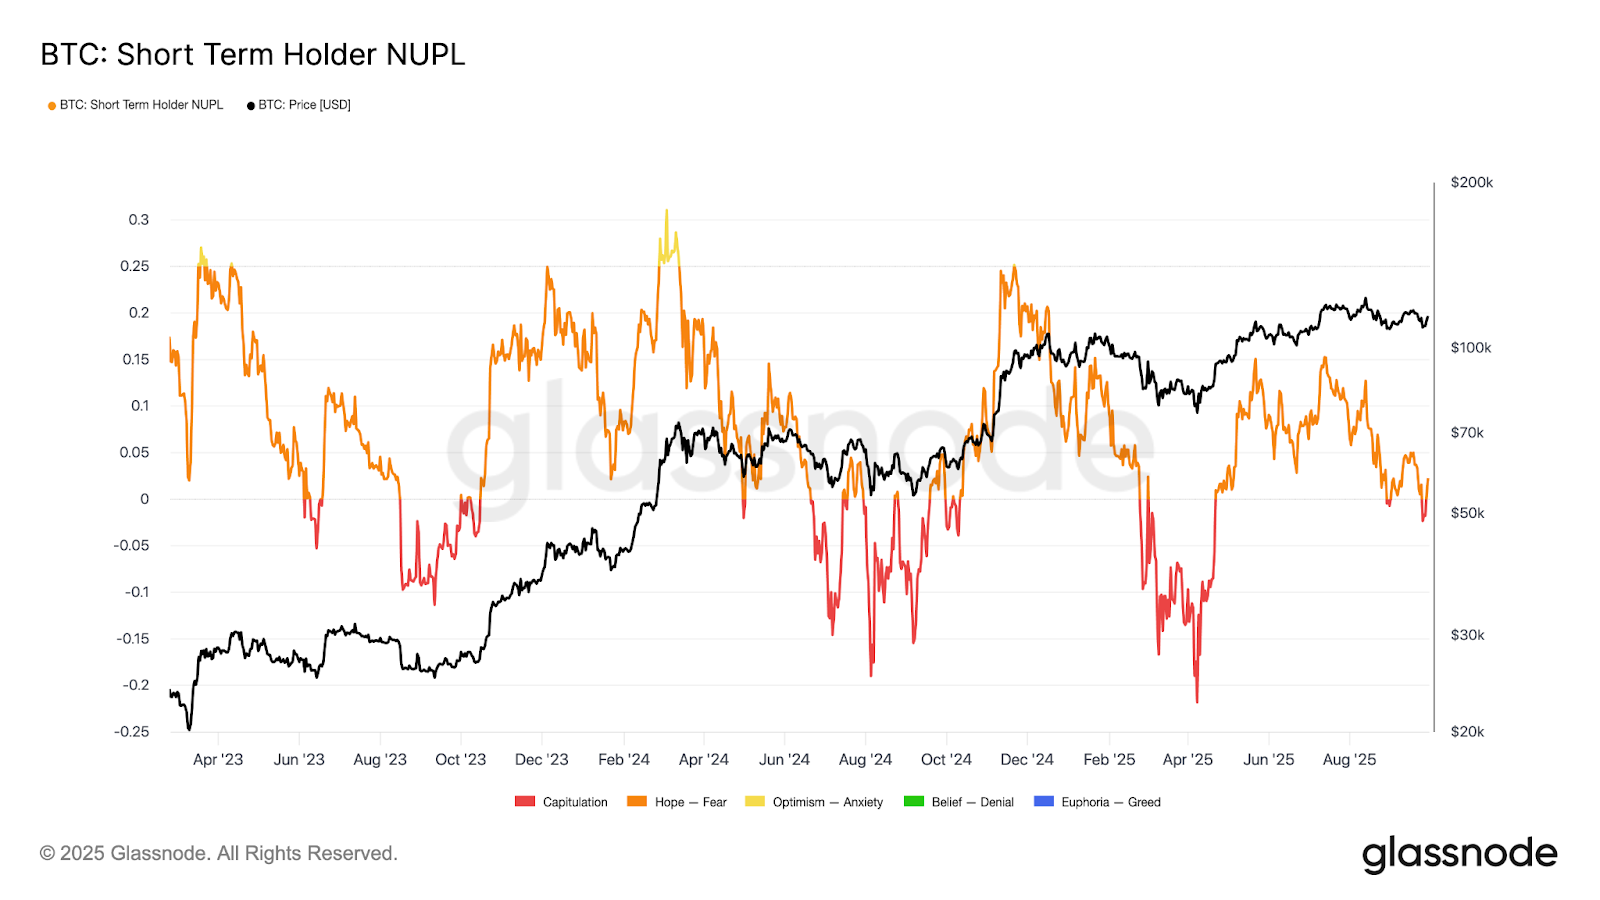
“History says this capitulation zone often marks local bottoms,” said crypto influencer Jack in an X post on Tuesday, adding:
“The setup screams early accumulation.”
Historically, negative short-term holder NUPL has coincided with price bottoms during bear markets or corrections, as it indicates widespread exhaustion among sellers.
Once this selling pressure subsides, demand from long-term holders or new buyers can stabilize and drive prices upward.
For example, negative NUPL readings were observed near the April local bottom below $75,000, before the BTC/USD pair price rallied 65% to its $124,500 record high.
More charts hint at $108,000 BTC price bottom
BTC’s price action since Sept. 18 has led to the appearance of a V-shaped pattern on the 12-hour chart. This follows an initial drop that saw Bitcoin decline 7.8% to a low of $108,700 on Thursday.
Buyers accumulated more on this dip, resulting in a sharp reversal to the current levels. The relative strength index (RSI) has increased to 53 from the oversold zone at 27, indicating an increasing upward momentum.
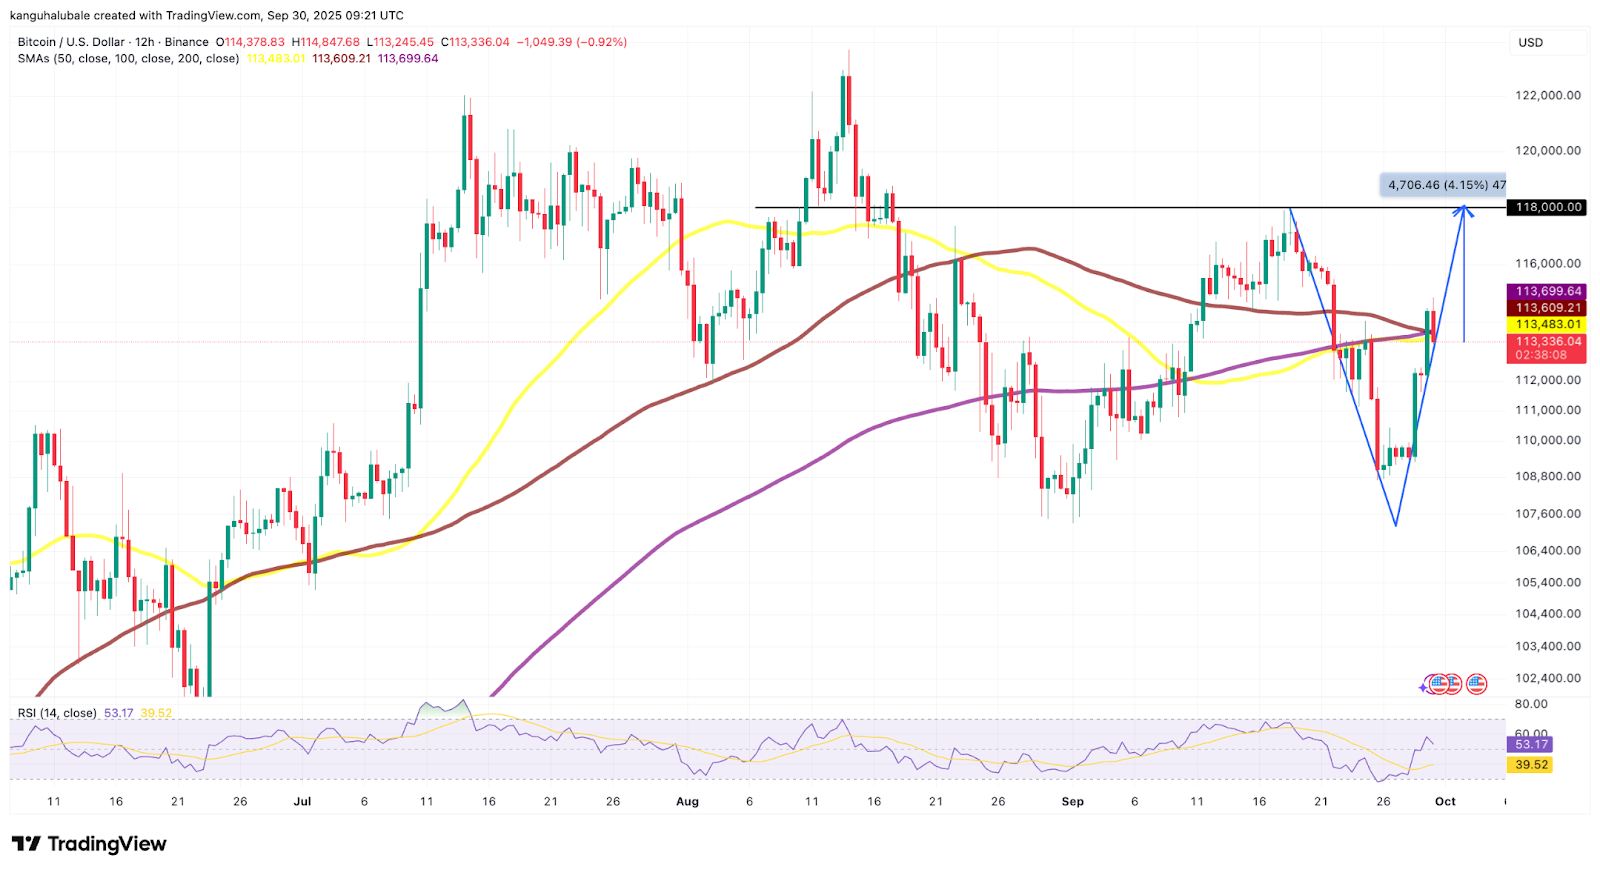
As the price attempts to complete the V-shaped pattern, it could rise further toward the pattern’s neckline, around the $118,000 resistance zone, representing a 4% price increase from the current level.
Zooming out, a double-bottom formation on the daily chart projects a return to the all-time highs at $124,500, once the resistance at $118,00 is broken. Such a move would bring the total gains to 10% from the current price.
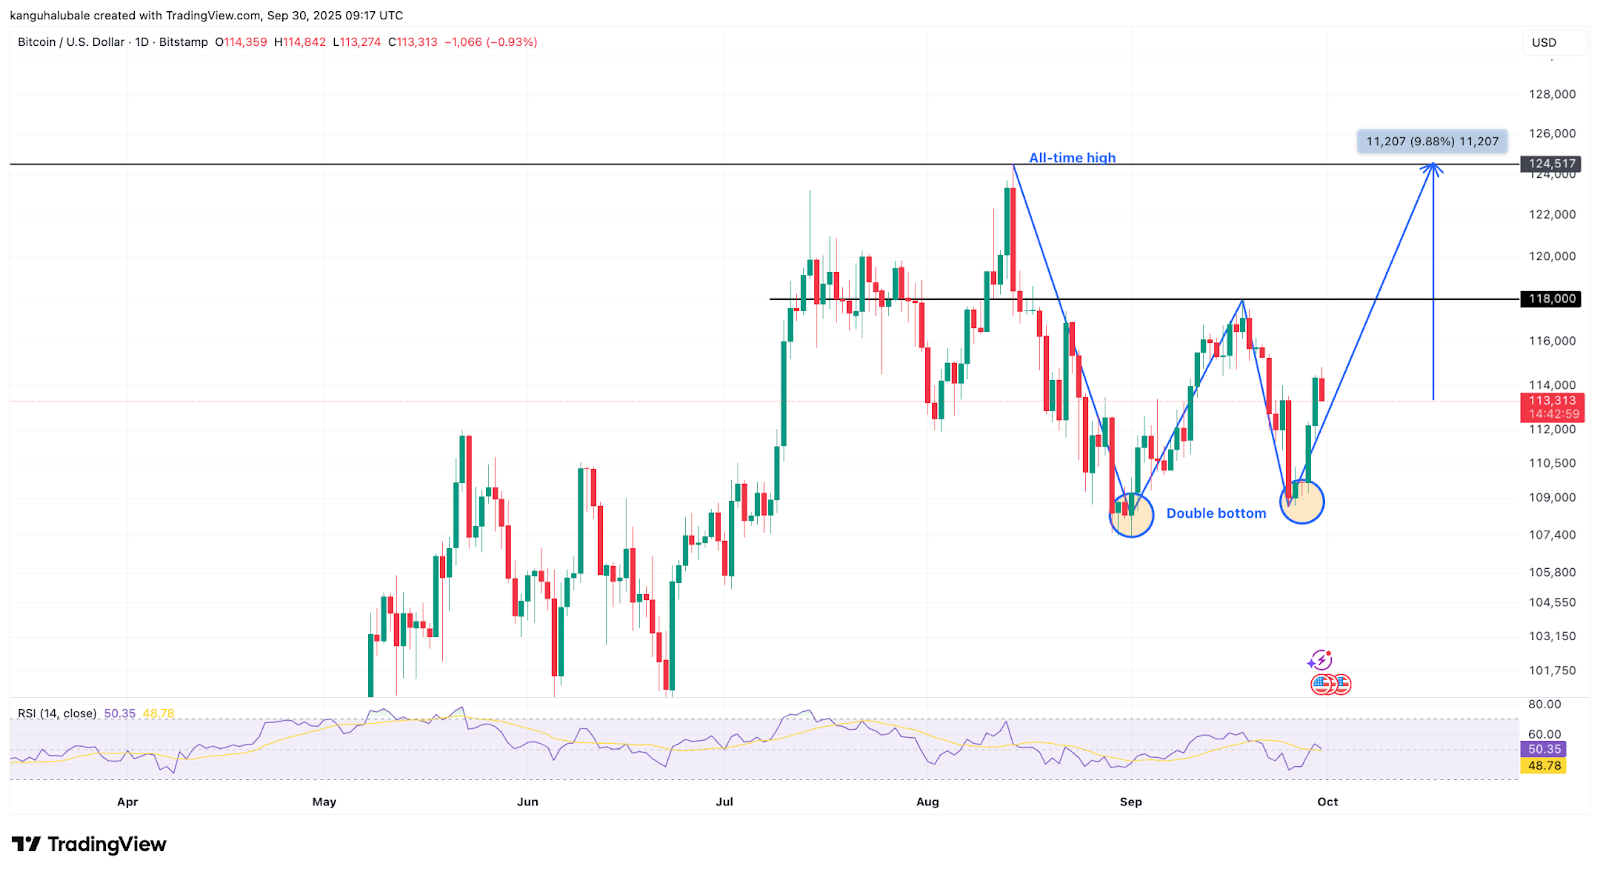
Bitcoin’s market structure is “just clean,” said crypto analyst Matthew Hyland, referring to a double bottom in the daily time frame and a potential breakout from an inverse head-and-shoulders pattern.
“Entering Q4 post halving where BTC has found cycle highs historically”
As Cointelegraph reported, BTC price may rally toward the $140,000 range next if the resistance between $112,000 and $114,000 is broken.
This article does not contain investment advice or recommendations. Every investment and trading move involves risk, and readers should conduct their own research when making a decision.


