On-chain data suggests the Bitcoin price found its bottom following the recent crash around this important investor cost basis level.
Bitcoin Found Its Bottom Near Active Investor’s Cost Basis
According to the latest weekly report from Glassnode, Bitcoin formed its recent bottom near the cost basis of the “active investors.” To understand what this level represents, two other indicators need to be looked at first: the Realized Price and the Liveliness.
Related Reading
The Realized Price refers to the cost basis or acquisition price of the average investor on the BTC network. The metric determines this by going through the transaction history of each token in circulation to find what price it was last moved at.
It then works with the assumption that this previous transfer was the last time that the coin changed hands and so, takes the price at its time to be its current cost basis. Finally, it averages this value out for the entire supply, producing a price that’s often considered to be BTC’s “fair value.”
The other indicator, the Liveliness, basically keeps track of the spending/HODLing behavior of the investors. This metric makes use of the concept of “coin days” to calculate its value. A coin day is a quantity that 1 BTC is said to accumulate after staying dormant on the blockchain for 1 day.
Thus, when HODLing occurs on the network, new coin days are “created” each day, while when spending occurs, coin days that had been accumulated earlier are “destroyed.”
The Liveliness measures the ratio between the cumulative sum of coin days destroyed and the cumulative sum of coin days created over the cryptocurrency’s history.
As such, whenever the market is showing a HODLing dominant behavior, the metric’s value tends towards the zero mark, as a low amount of coin days are seeing destruction. Similarly, it leans towards 1 when distribution is high.
Now, the actual indicator of focus in the current discussion is the “Realized Price-to-Liveliness Ratio,” also known as the Active Investor’s Cost Basis. This indicator adds a weightage factor to Bitcoin’s Realized price (that is, its fair value) using the Liveliness.
Related Reading
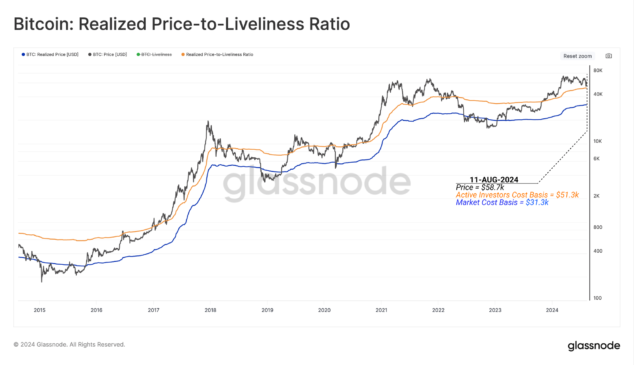
With this modification, BTC’s fair value is estimated higher when HODLing is dominant and lower when distribution is happening. The below chart shows the trend in the Bitcoin Realized Price-to-Liveliness Ratio over the past decade:
As displayed in the above graph, the Bitcoin Realized Price-to-Liveliness Ratio is currently at a value of $51,300. In The recent price crash, BTC ended up finding a bottom not too far from this mark.
“The Active Investor’s Cost-Basis can be considered as a key threshold delineating bullish and bearish investor sentiment,” notes Glassnode. “Since the market managed to find support near this level speaks to a degree of underlying strength, suggesting investors are generally still anticipating positive market momentum in the short-to-medium-term.”
BTC Price
Bitcoin has seen a jump of almost 4% during the last 24 hours, which has taken its price above $61,000.

Featured image from Dall-E, Glassnode.com, chart from TradingView.com


