A rare bullish crossover between two on-chain metrics could soon be forming for Bitcoin. Here’s when this analyst believes the cross would happen.
Bitcoin Realized Prices Of Two UTXO Age Bands Are Moving Towards A Cross
As explained by an analyst in a CryptoQuant Quicktake post, a bullish crossover is expected to happen soon for BTC. The indicator of interest here is the “realized price,” which basically keeps track of the price at which the average investor in the Bitcoin market acquired their coins.
The indicator calculates this value by going through the on-chain history of each coin in circulation to see what price it was last transacted at. The metric assumes this price to be its buying price and so, after taking the mean of this value for all tokens on the network, the average cost basis of all coins is obtained.
When the cryptocurrency’s price is under this metric, it means that the average holder in the sector is in a state of loss. On the other hand, the price being above the indicator implies the overall market is enjoying net profits.
The realized price of the entire user base isn’t of relevance in the context of the current discussion, but two specific UTXO age bands which are 6 months to 12 months and 12 months to 18 months. What these age bands signify is that the coins (or more accurately, UTXOs) belonging to them were last moved inside their range.
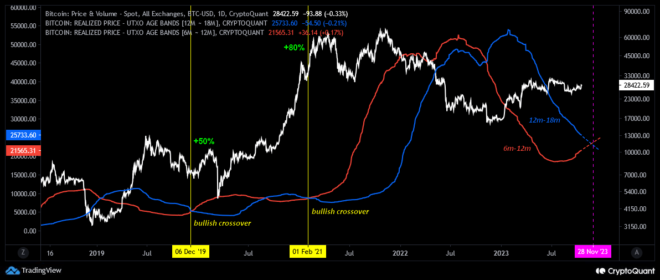
Now, here is a chart that shows the trend in the Bitcoin realized price for these two UTXO age bands over the past few years:
Looks like the the two metrics have been approaching each other in recent days | Source: CryptoQuant
As displayed in the above graph, the realized price of the UTXOs sitting dormant between 12 and 18 months ago has been heading down for a while now. The 6-month to 12 months age band had been showing a similar trajectory earlier in the year, but a while back, the metric plateaued and has since then turned itself around.
The reason the average cost basis of investors belonging to this age band has reversed its trajectory is that the 6 months cutoff for the group now lies in April, which means that those who bought during the rally in the starting months of the year would now be counted under this cohort.
Earlier in the year, the bear market buyers were a part of the group, so the average naturally headed down. The 12-month to 18-month-old group, on the other hand, still constitutes these bear market buyers, hence why its realized price is still decreasing.
If these two metrics continue in their current trajectories, they will go through a crossover. As the quant has highlighted in the chart, such a crossover where the 6 months to 12 months band has broken above the 12 months to 18 months cohort, has historically proven to be bullish for the asset.
In total, there have only been four such crossovers in the cryptocurrency’s entire history, so if this crossover goes on to form, it would only be the fifth ever. The analyst believes that November 28, 2023, is when this bullish crossover could be expected to form for Bitcoin.
BTC Price
Bitcoin had made a push toward the $29,000 level yesterday, but it appears the surge has already calmed down as the coin has retraced towards $28,400.
BTC appears to have overall moved sideways in the last two days | Source: BTCUSD on TradingView
Featured image from Shutterstock.com, charts from TradingView.com, CryptoQuant.com


