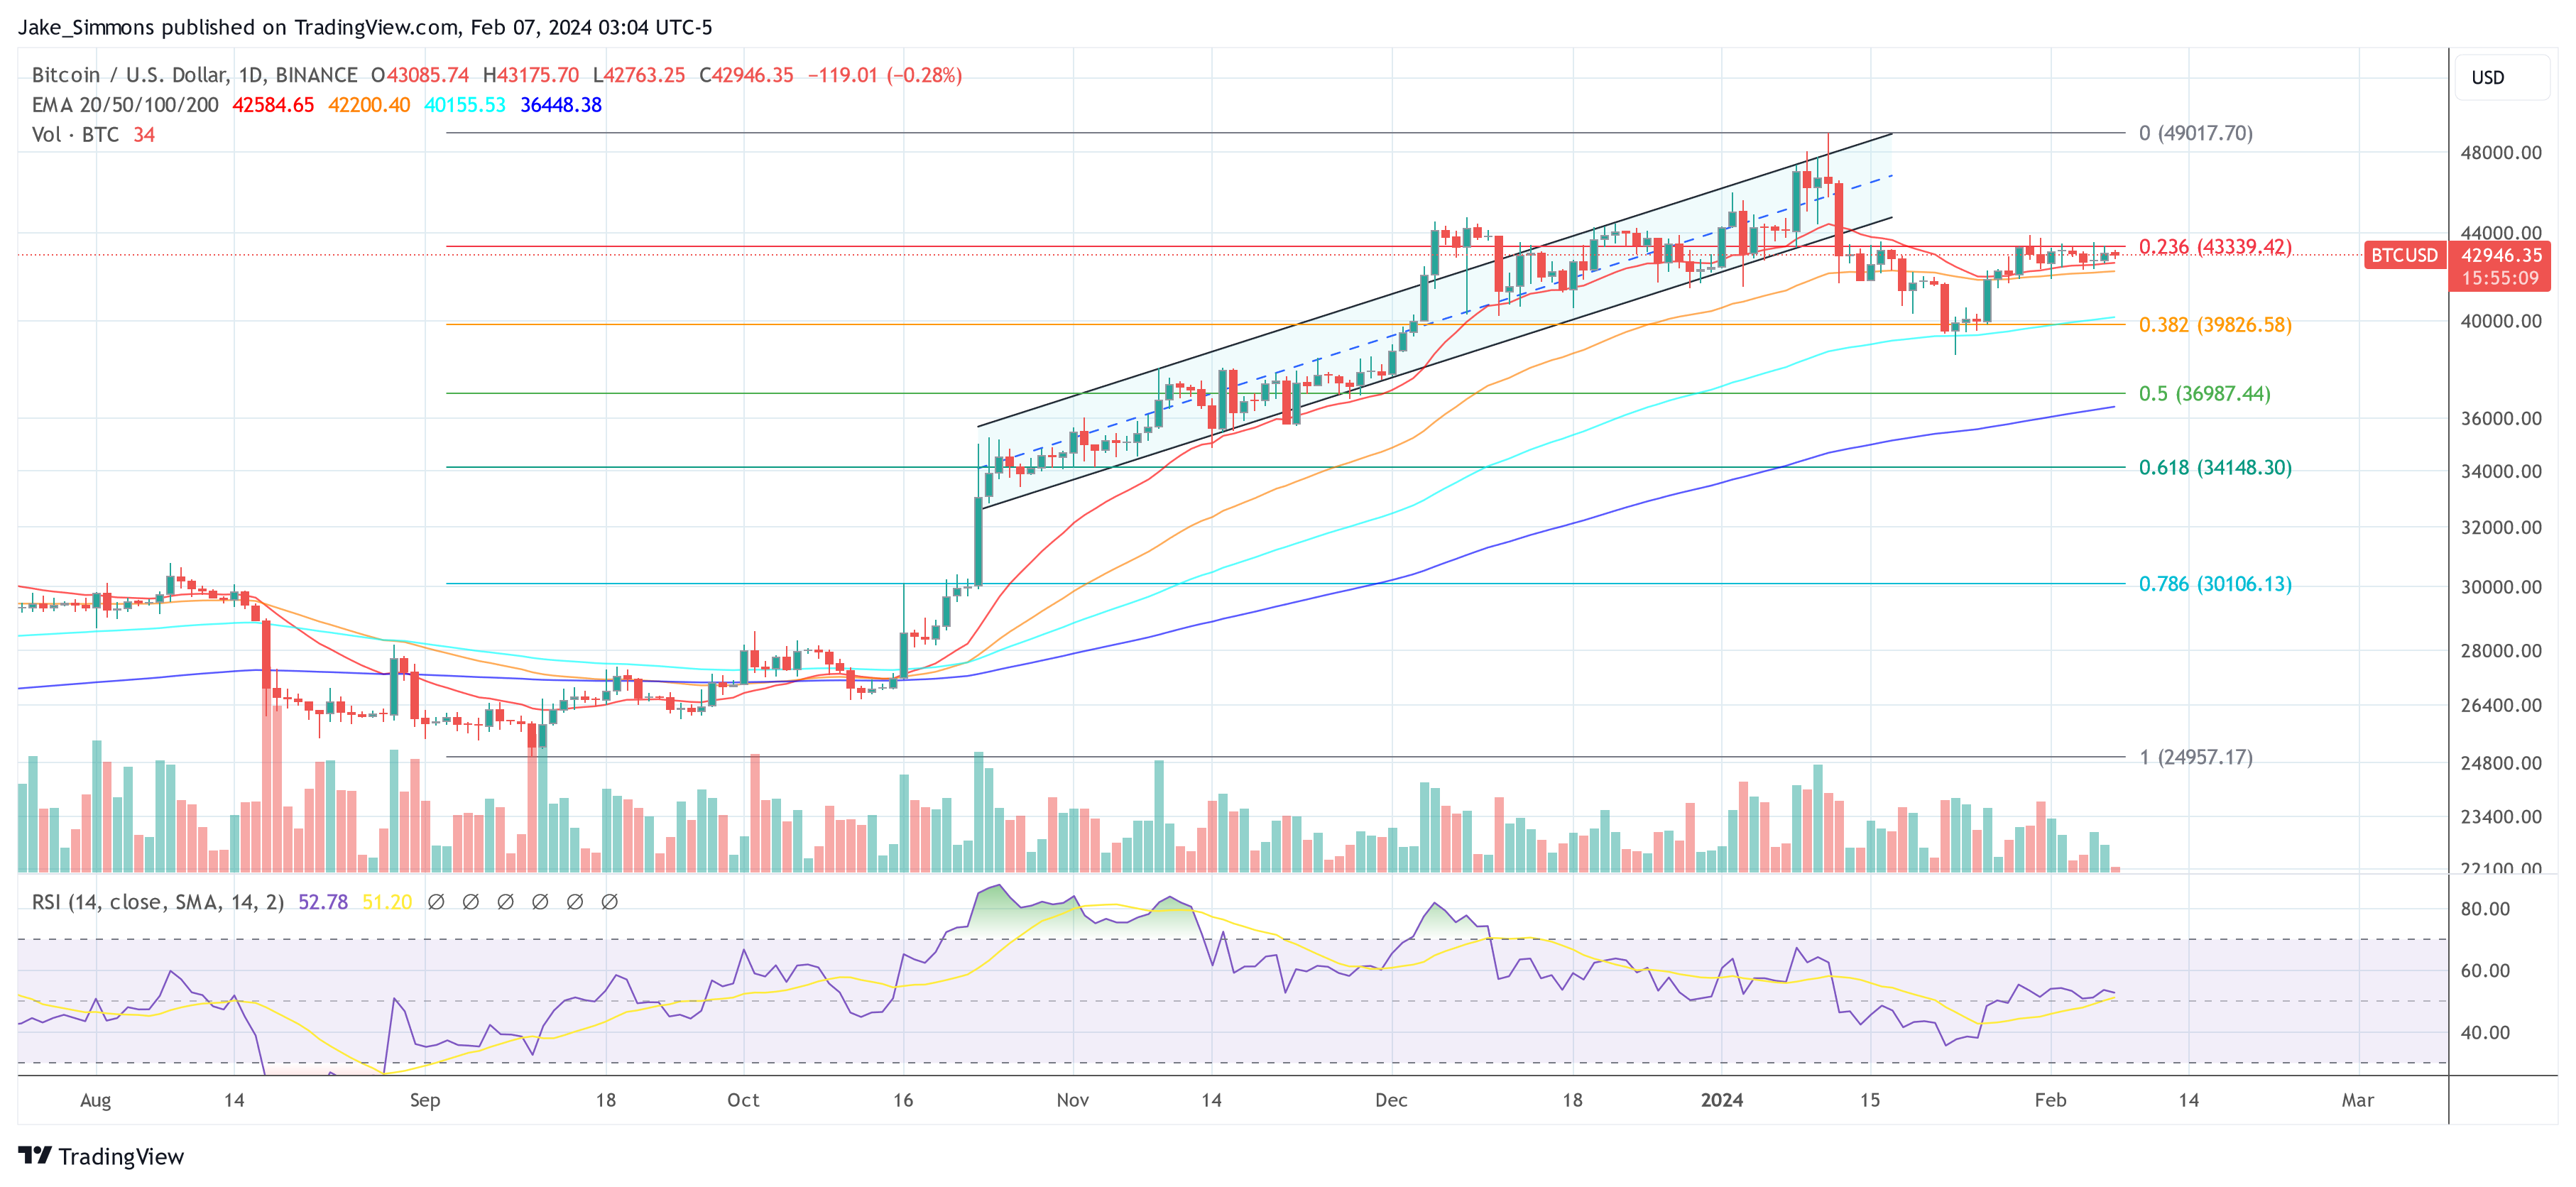
Bitcoin has been moving sideways since mid-January, when the price broke out of a parallel upward channel to the downside. The BTC price is currently around the same price as on January 13. However, the time of dullness could soon be over, as the Bollinger Band Width (BBW) indicator signals.
The BBW is derived from the Bollinger Bands themselves, which consist of a middle line (typically a simple moving average) surrounded by an upper and lower band. These bands expand and contract based on the standard deviation of the price from the mean, which is a measure of volatility. The BBW quantifies the degree of these bands’ divergence or convergence by calculating the ratio of the difference between the upper and lower bands to the middle band.
Bitcoin Mega Squeeze Incoming
In an analysis on X (formerly Twitter), crypto analyst HornHairs has drawn attention to the BBW which currently shows a reading close to 0.11. This number is significant because it suggests that the bands are very close together, indicating a period of low volatility or a ‘squeeze.’ He remarked:
BTC MEGA VOL SQUEEZE: We probably have 10 days MAX before a huge move on BTC. Now’s the time to get your plan ready for either direction, don’t want to be stuck in a frozen panic with no plan if things launch upwards or nuke lower. It’s coming very soon.
Historically, such a squeeze is often followed by a period of high volatility, as the market moves to find a new price equilibrium. The key takeaway from the BBW’s current low reading is that the market should prepare for a sharp increase in volatility, leading to a strong upward or downward movement in Bitcoin’s price.
The term “Mega Squeeze” used by HornHairs points to the unusually tight convergence of the Bollinger Bands, implying that the subsequent market move could be more pronounced than what is typically observed following a BBW contraction. The last few times the BBW approached such low levels, Bitcoin experienced significant price swings shortly thereafter. These historical precedents serve as a guide to what might occur in the days ahead.
The last instance of the BBW reaching its current low was observed on October 13 last year. Subsequent to this indicator, BTC experienced a significant rally, ascending over 30% in a mere 10 days. In a contrasting scenario, mid-August 2023 saw the BTC value decline by 15% in just 8 days. Additionally, at the outset of January 2023, Bitcoin showcased a remarkable surge, escalating by 40% within a span of 17 days.
As of press time, Bitcoin was hovering around $42,900, with a recent peak at $49,000 and a local low at $38,600. These price points will be crucial to watch as the market navigates through this period of constricted volatility. The BBW suggests that the breakout, whether bullish or bearish, will likely drive the price towards or even beyond these levels, marking a new phase of market activity.
Renowned crypto analyst CrediBULL commented on the emergence of the indicator: “Volatility soon. Big move coming. My bet is UP and the start of our next impulsive leg that we have been anticipating. Place your bets and pack your bags frens.”
The next key resistance on the 1-day chart of BTC/USD is at $43,340 (0.236 Fibonacci retracement level), while the region at $39,800 (0.386 Fibonacci level) provides key support.

Featured image created with DALL·E, chart from TradingView.com
Disclaimer: The article is provided for educational purposes only. It does not represent the opinions of NewsBTC on whether to buy, sell or hold any investments and naturally investing carries risks. You are advised to conduct your own research before making any investment decisions. Use information provided on this website entirely at your own risk.


