Bitcoin (BTC) remains a slave of the U.S. dollar on April 27 as the greenback spells fresh misery for risk assets across the board.
BTC faces off with the support zone to hold
Data from Cointelegraph Markets Pro and TradingView showed a precarious picture of BTC markets on April 27 as bulls battled for control of short-term support levels.
After dipping to $37,700 on April 26, Bitcoin saw a relief bounce that culminated in a rebound to $39,200 — a zone th is now critical to flip back to support, one trader says.
In his latest YouTube update, Cointelegraph contributor Michaël van de Poppe highlighted the area around $39,300 as a springboard for BTC/USD to attack short-timeframe resistance. Flip it, he said, and the pair could then target $42,600.
“If we lose this one, I think we are looking for short opportunities,” he explained, with possible confirmations of a bottom coming below $37,000.
“If we lose this level as support, I think it could be nosediving as we’re going to trigger liquidity below the lows and then we might be testing some lower levels in which ultimately, if the markets are really ready to nuke, I’m looking at $30,000 as the ultimate bottom for the markets.”
Van de Poppe is far from alone in calling for a $10,000 step down. In recent weeks, several figures have given $30,000 as a target, among them former BitMEX CEO Arthur Hayes and Bloomberg Intelligence chief commodities strategist Mike McGlone.
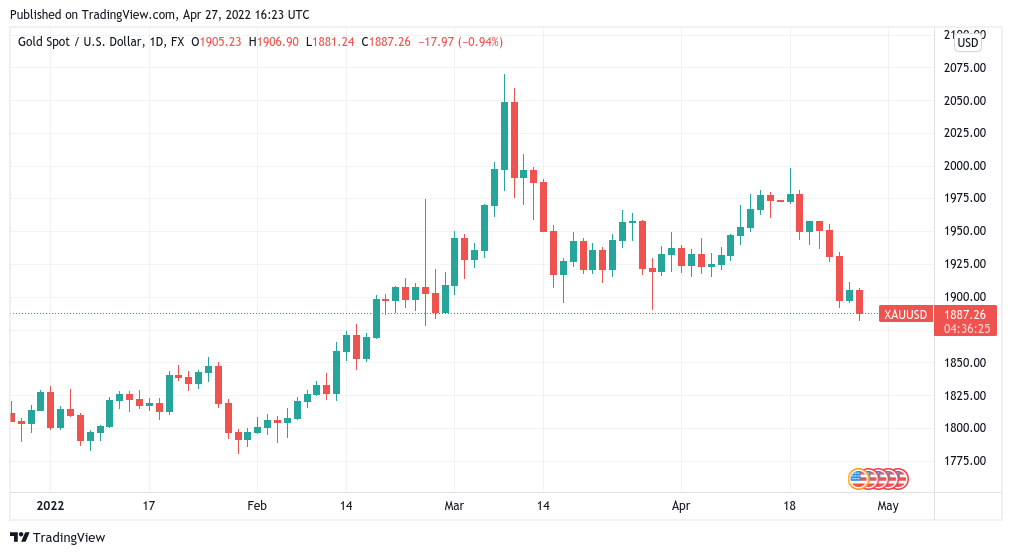
In his latest blog post, meanwhile, Hayes expanded on his short- to the mid-term view of asset prices, forecasting a dramatic renaissance in both Bitcoin and gold, which he says will hit $1 million and up to $20,000, respectively, by 2030.
XAU/USD traded at $1,887 at the time of writing, having almost hit $2,000 on April 18.

Dollar checks rise as crucial resistance nears
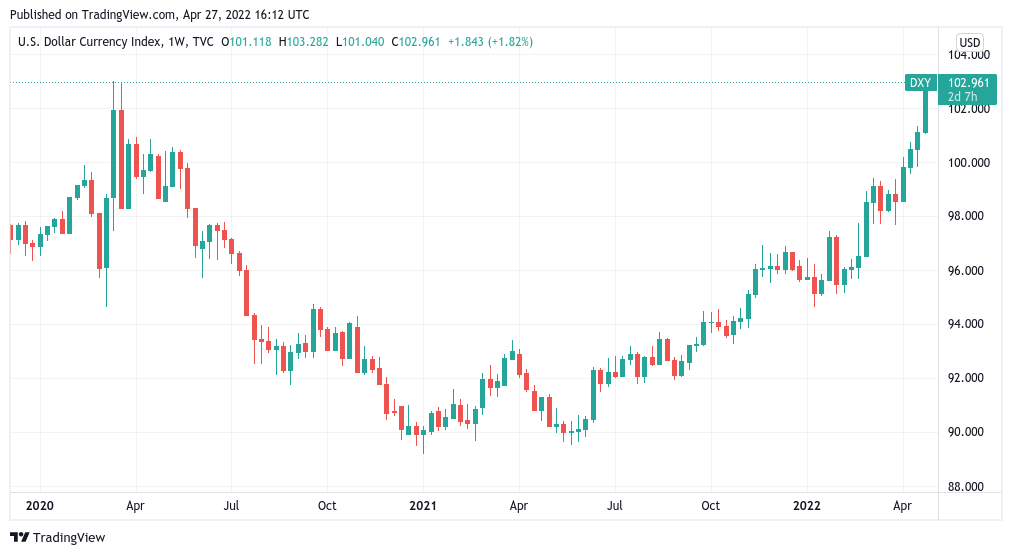
As throughout this week, everything hinges on the U.S. dollar currency index (DXY).
Related: Purpose Bitcoin ETF adds 1.1K BTC as data hints investors want to ‘buy the dip’
Reaching 103.28 on April 27, DXY is attempting to match and break above its highs from March 2020, something that would mean multi-decade highs should it succeed.
Van de Poppe flagged 103.77 as the level to watch, while a break in the upside would reduce pressure on Bitcoin and other risk assets.
“If the DXY is finding itself a top — which is most likely going to be above those highs — and take the liquidity there, I think you’ll want to be long Bitcoin,” he added, predicting a “serious run” for BTC should a DXY retracement come in tandem with BTC/USD reclaiming support.

The views and opinions expressed here are solely those of the author and do not necessarily reflect the views of Cointelegraph.com. Every investment and trading move involves risk, you should conduct your own research when making a decision.


