
Bitcoin (BTC) returned to $90,000 after Wednesday’s Wall Street open as traders eyed vulnerable short positions.
Key points:
-
Bitcoin erases recent losses with a fresh trip to the $90,000 mark.
-
Liquidity games remain the key driver of short-term BTC price action, with shorts this time getting punished.
-
Bearish price predictions include a “breakdown” below the 100-week moving average cloud.
Liquidity-hungry Bitcoin grills late shorts
Data from Cointelegraph Markets Pro and TradingView showed erratic BTC price action sparking 2.5% daily gains before a reversal.
The momentum copied Tuesday’s US open, which saw a “battle” unfold between buyers and sellers. Then, as now, liquidity on both sides of the price was in the firing line.
“A great move upwards on $BTC and there are a lot of shorts ready to be taken out,” crypto trader, analyst and entrepreneur Michaël van de Poppe reacted on X, calling price action “great.”
“The $88K breakout is crucial, I think that it’s very likely that we’ll start moving all the way to $93-94K.”
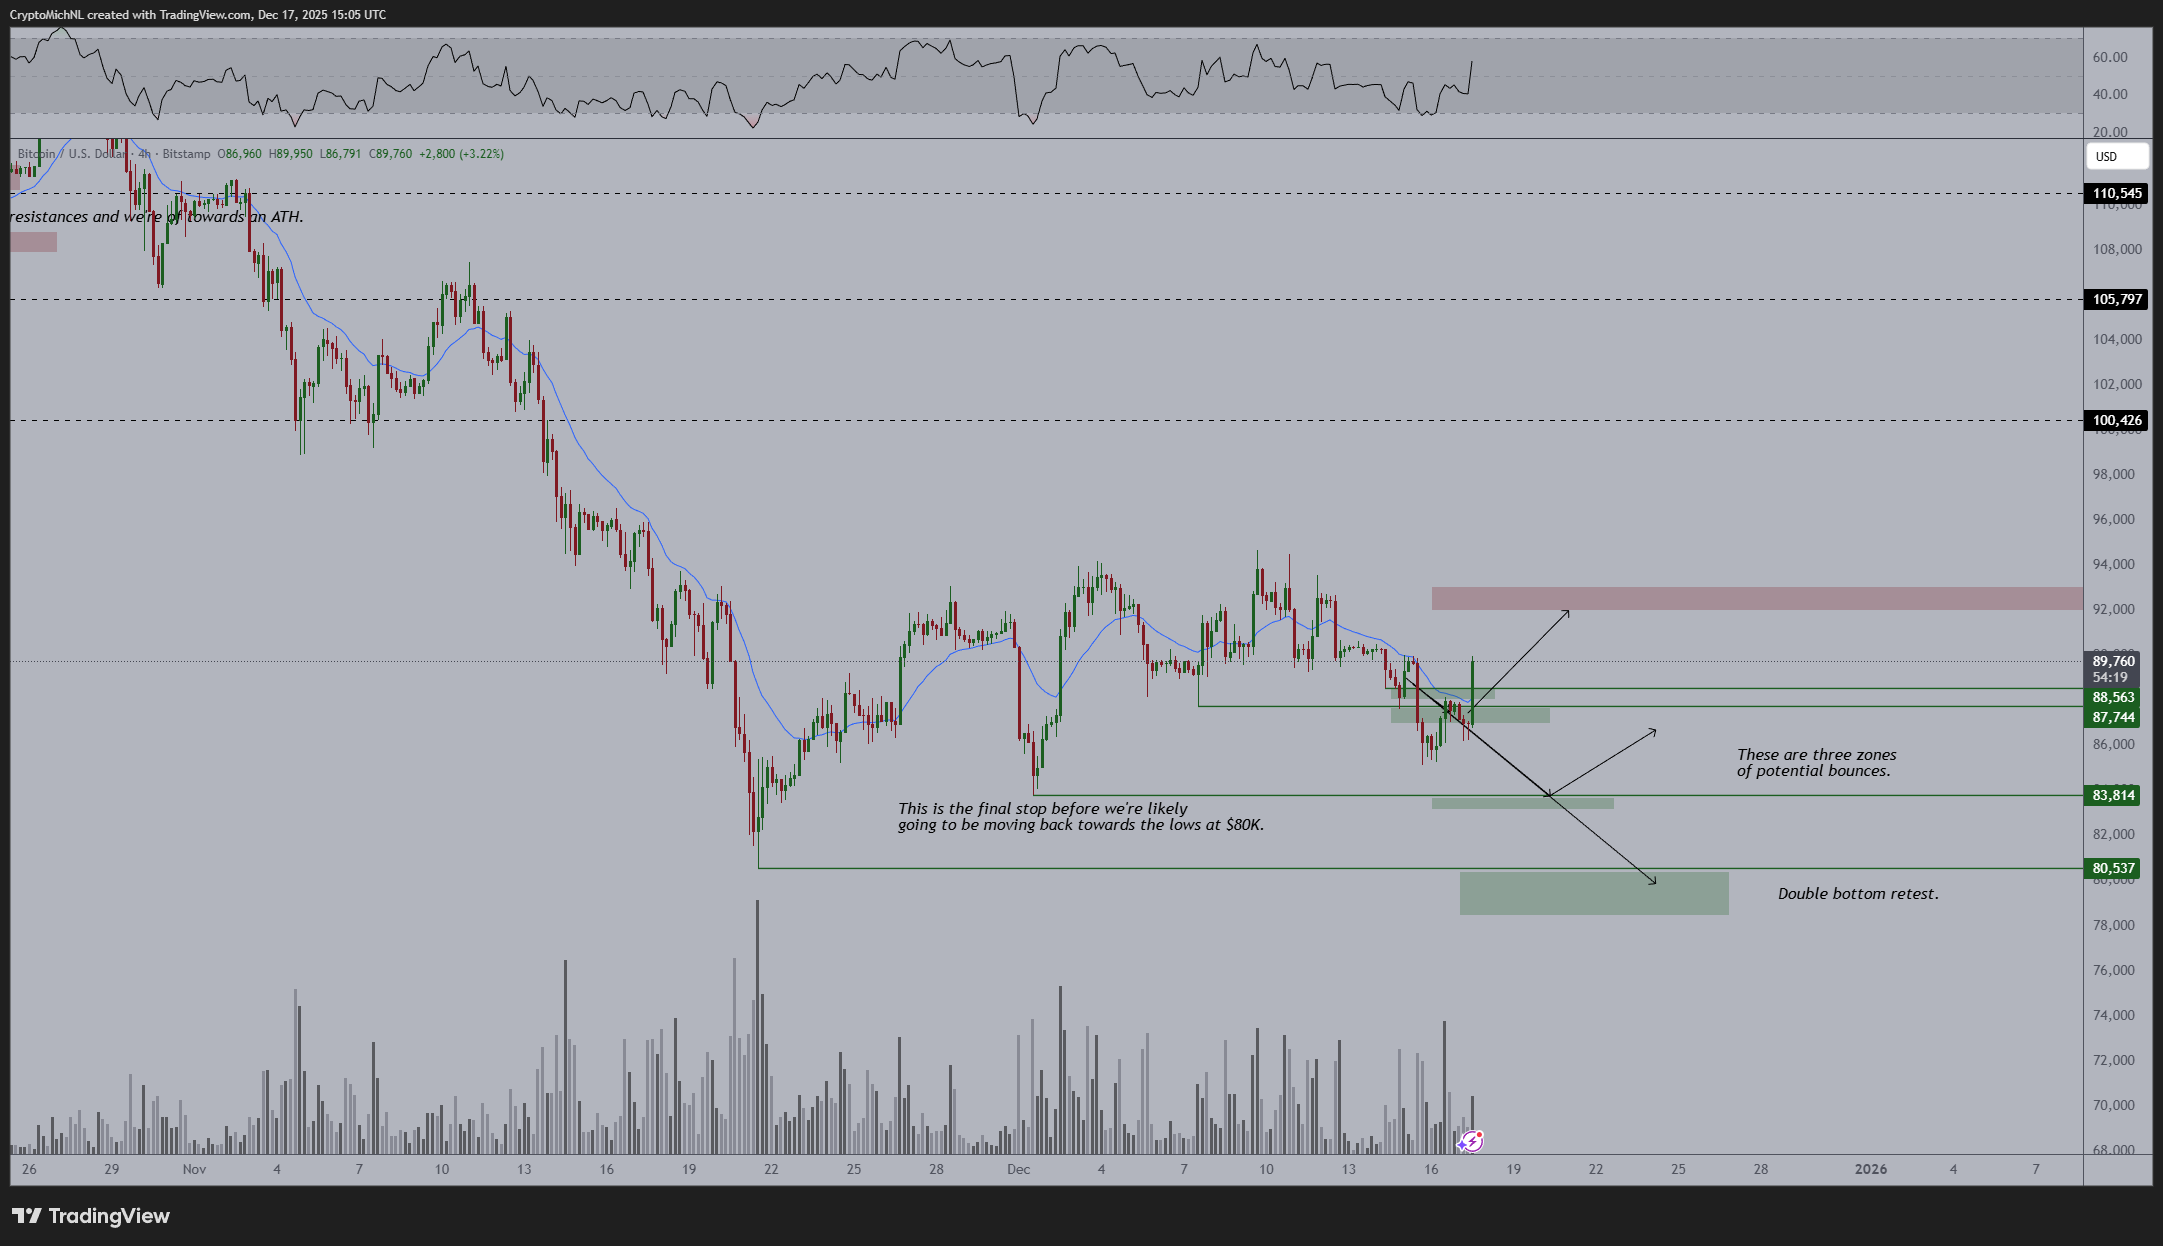
Commentator Exitpump likewise praised a “strong” start to the US session, eyeing shorts getting “squeezed” above $88,000.
$BTC Quick pump right above 88K as mentioned earlier, some shorts got squeezed here, strong NYO https://t.co/IDIhLYLB3h pic.twitter.com/X48EC2Bq5U
— exitpump (@exitpumpBTC) December 17, 2025
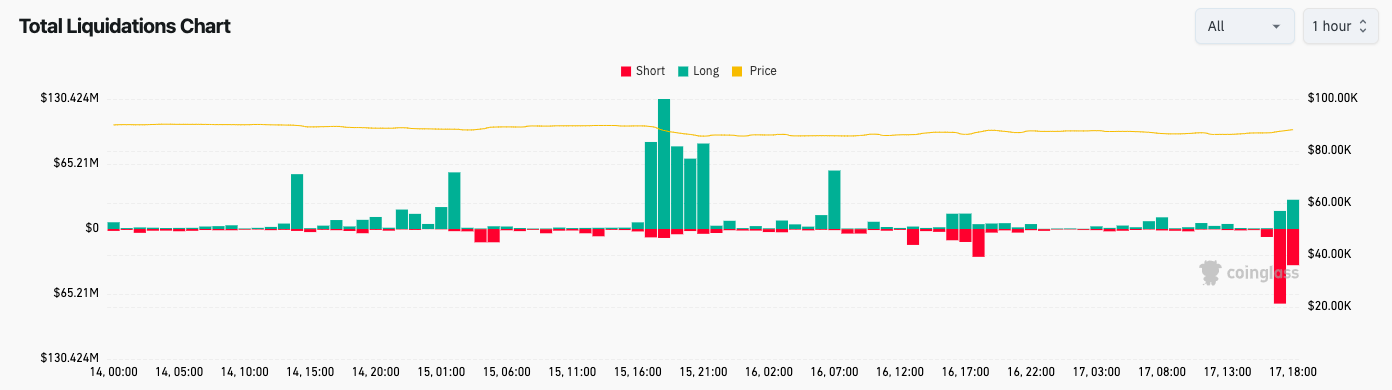
The latest data from monitoring resource CoinGlass showed crypto short liquidations over the four hours to the time of writing passing $120 million.
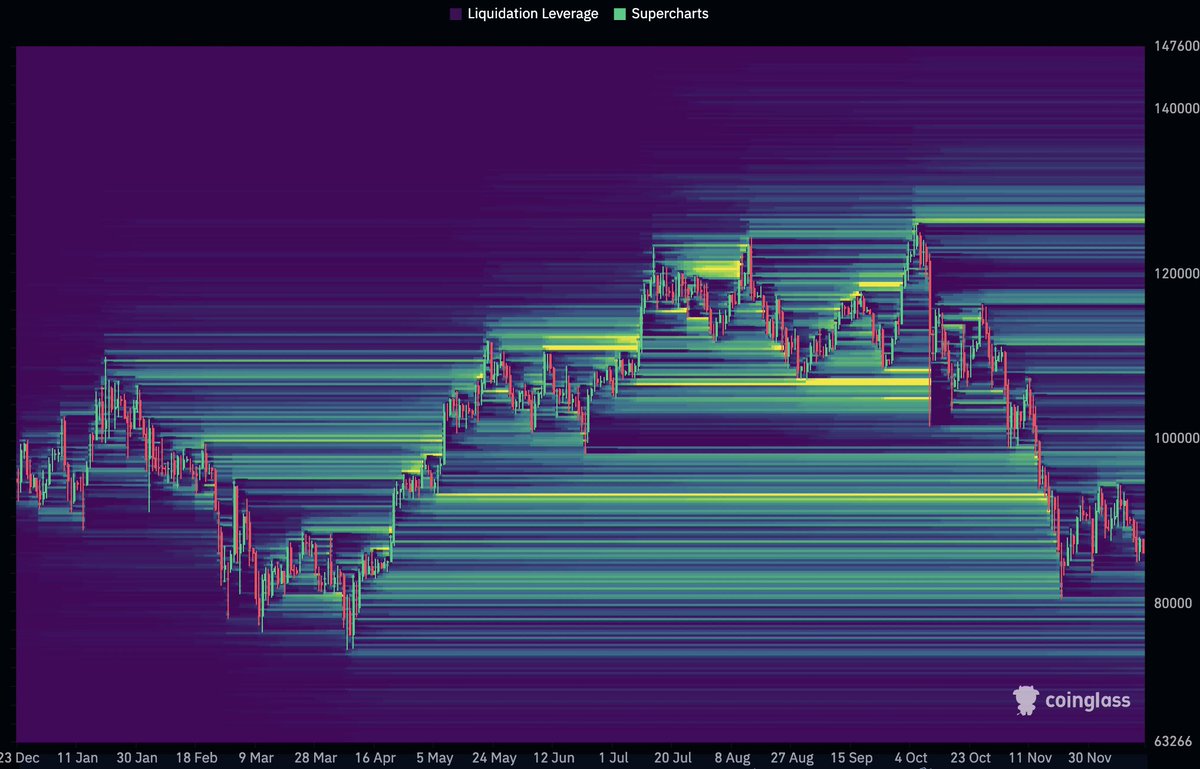
“$BTC Pretty much back to where it traded about 6 months ago. Liquidity taken on the way up and on the way down,” trader Daan Crypto Trades summarized about longer timeframes.
“The biggest liquidity cluster in relatively close proximity sits at $95K. But all in all it’s pretty empty all things considered.”
BTC price “breakdown” still expected
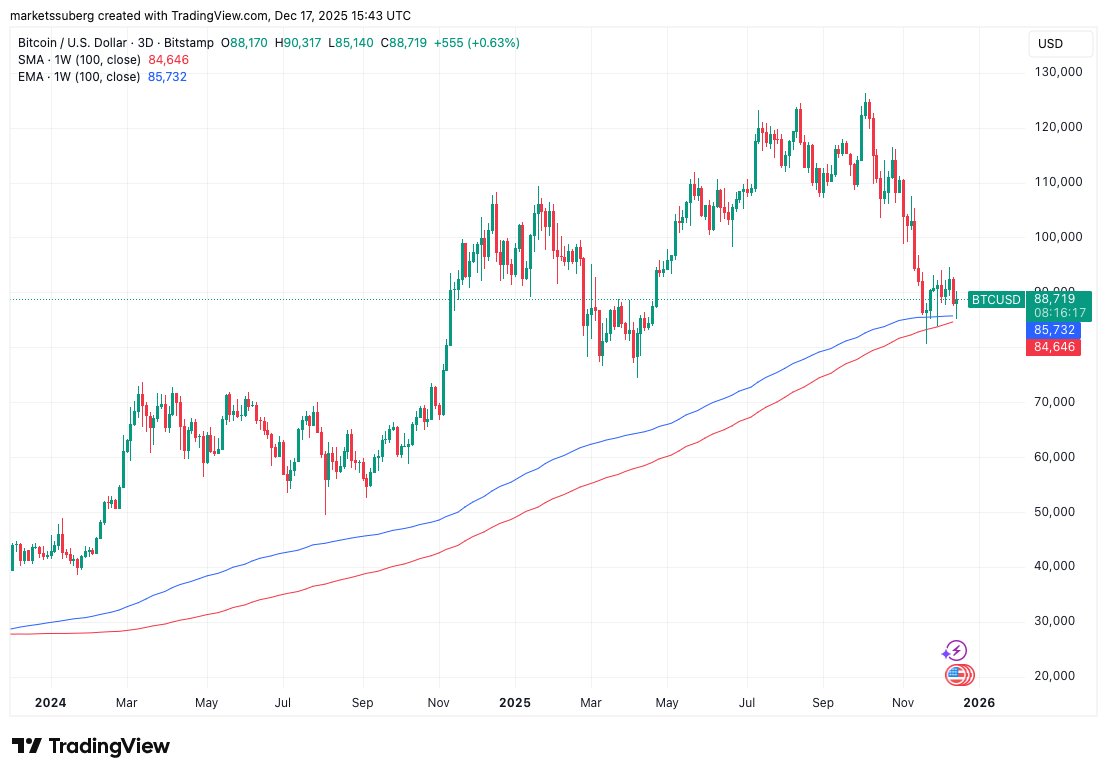
For Caleb Franzen, creator of trading resource Cubic Analytics, Bitcoin’s 100-week simple (SMA) and exponential (EMA) moving averages were key.
Related: Bitcoin institutional buys flip new supply for the first time in 6 weeks
As Cointelegraph reported, these levels, now both just below $85,000, were already on the radar as a form of last-ditch support level.
“Bitcoin is on the verge of breaking below its 100-week moving average cloud, Franzen warned Tuesday.
Franzen thus joined those expecting a BTC price breakdown, saying that this should occur “soon” but that it would also provide an opportunity to buy the dip using dollar cost averaging (DCA).
Others continued to see new macro lows on the horizon, including $76,000, which trader Roman described as “coming in the near future.”
$BTC 1D
Formed bull divs + volume was low on the drop. Called this bounce point perfectly.
However, this is just a bounce, I don’t believe this leads into anything serious.
76k is coming in the near future. https://t.co/BSDHZICiqL pic.twitter.com/aw0xU9o06f
— Roman (@Roman_Trading) December 16, 2025
This article does not contain investment advice or recommendations. Every investment and trading move involves risk, and readers should conduct their own research when making a decision. While we strive to provide accurate and timely information, Cointelegraph does not guarantee the accuracy, completeness, or reliability of any information in this article. This article may contain forward-looking statements that are subject to risks and uncertainties. Cointelegraph will not be liable for any loss or damage arising from your reliance on this information.
This article does not contain investment advice or recommendations. Every investment and trading move involves risk, and readers should conduct their own research when making a decision. While we strive to provide accurate and timely information, Cointelegraph does not guarantee the accuracy, completeness, or reliability of any information in this article. This article may contain forward-looking statements that are subject to risks and uncertainties. Cointelegraph will not be liable for any loss or damage arising from your reliance on this information.

