The Bitcoin price is sustaining its bullish momentum from the previous day. Today, it surpassed the $27,000 threshold, a level not seen since August 31. Notably, BTC recorded its first green weekly closing candle in five weeks yesterday. As of press time, the Bitcoin price has reached an intra-day high of $27,267.
Why Is Bitcoin Price Up Today?
One major indicator that has captured analysts’ attention is the rapid increase in Open Interest. DaanCrypto, a noted figure in the crypto space, commented on the Open Interest of Bitcoin: “Bitcoin Open Interest has been ramping up like crazy these past few hours. Up +$850M in hours.” According to him, this can be an issue if spot bid disappears which could cause for a full retrace similar to before.
“This would then be due to underwater positions that entered near the top. If spot bid remains then these positions are obviously fine. Open Interest is now back to post Grayscale pump levels,” Daan stated, further noting the resilience in the spot premium at the moment, “Longs are comfy as long as spot bid is present.”
Maartuun, the community manager at CryptoQuant Netherlands, also highlights the rapid surge in Open Interest: “Fasten your seat belts. The Open Interest goes bonkers on this break-out attempt. It has increased by $600 million (7%).”
Interestingly, Coinglass data reveals that as of press time, short liquidations for BTC remain modest, with just about $20 million in shorts being liquidated. At press time, OI skyrocketed further, up almost $1 billion (from $11.04 to $12.03 billion).
Renowned analyst @52kskew emphasized the trading behavior on Binance: “Majority chasing shorts aggressively from what I can see so far. Binance Open Interest: Binance perp OI starting to moon again with minimal price difference ~ big move brewing. OI up and insignificant change in perp delta (positions opening into price). Takers still aggressively selling into price, bulls want to see constant limit chasing on the bid here. $26.7K pivotal price for direction.”
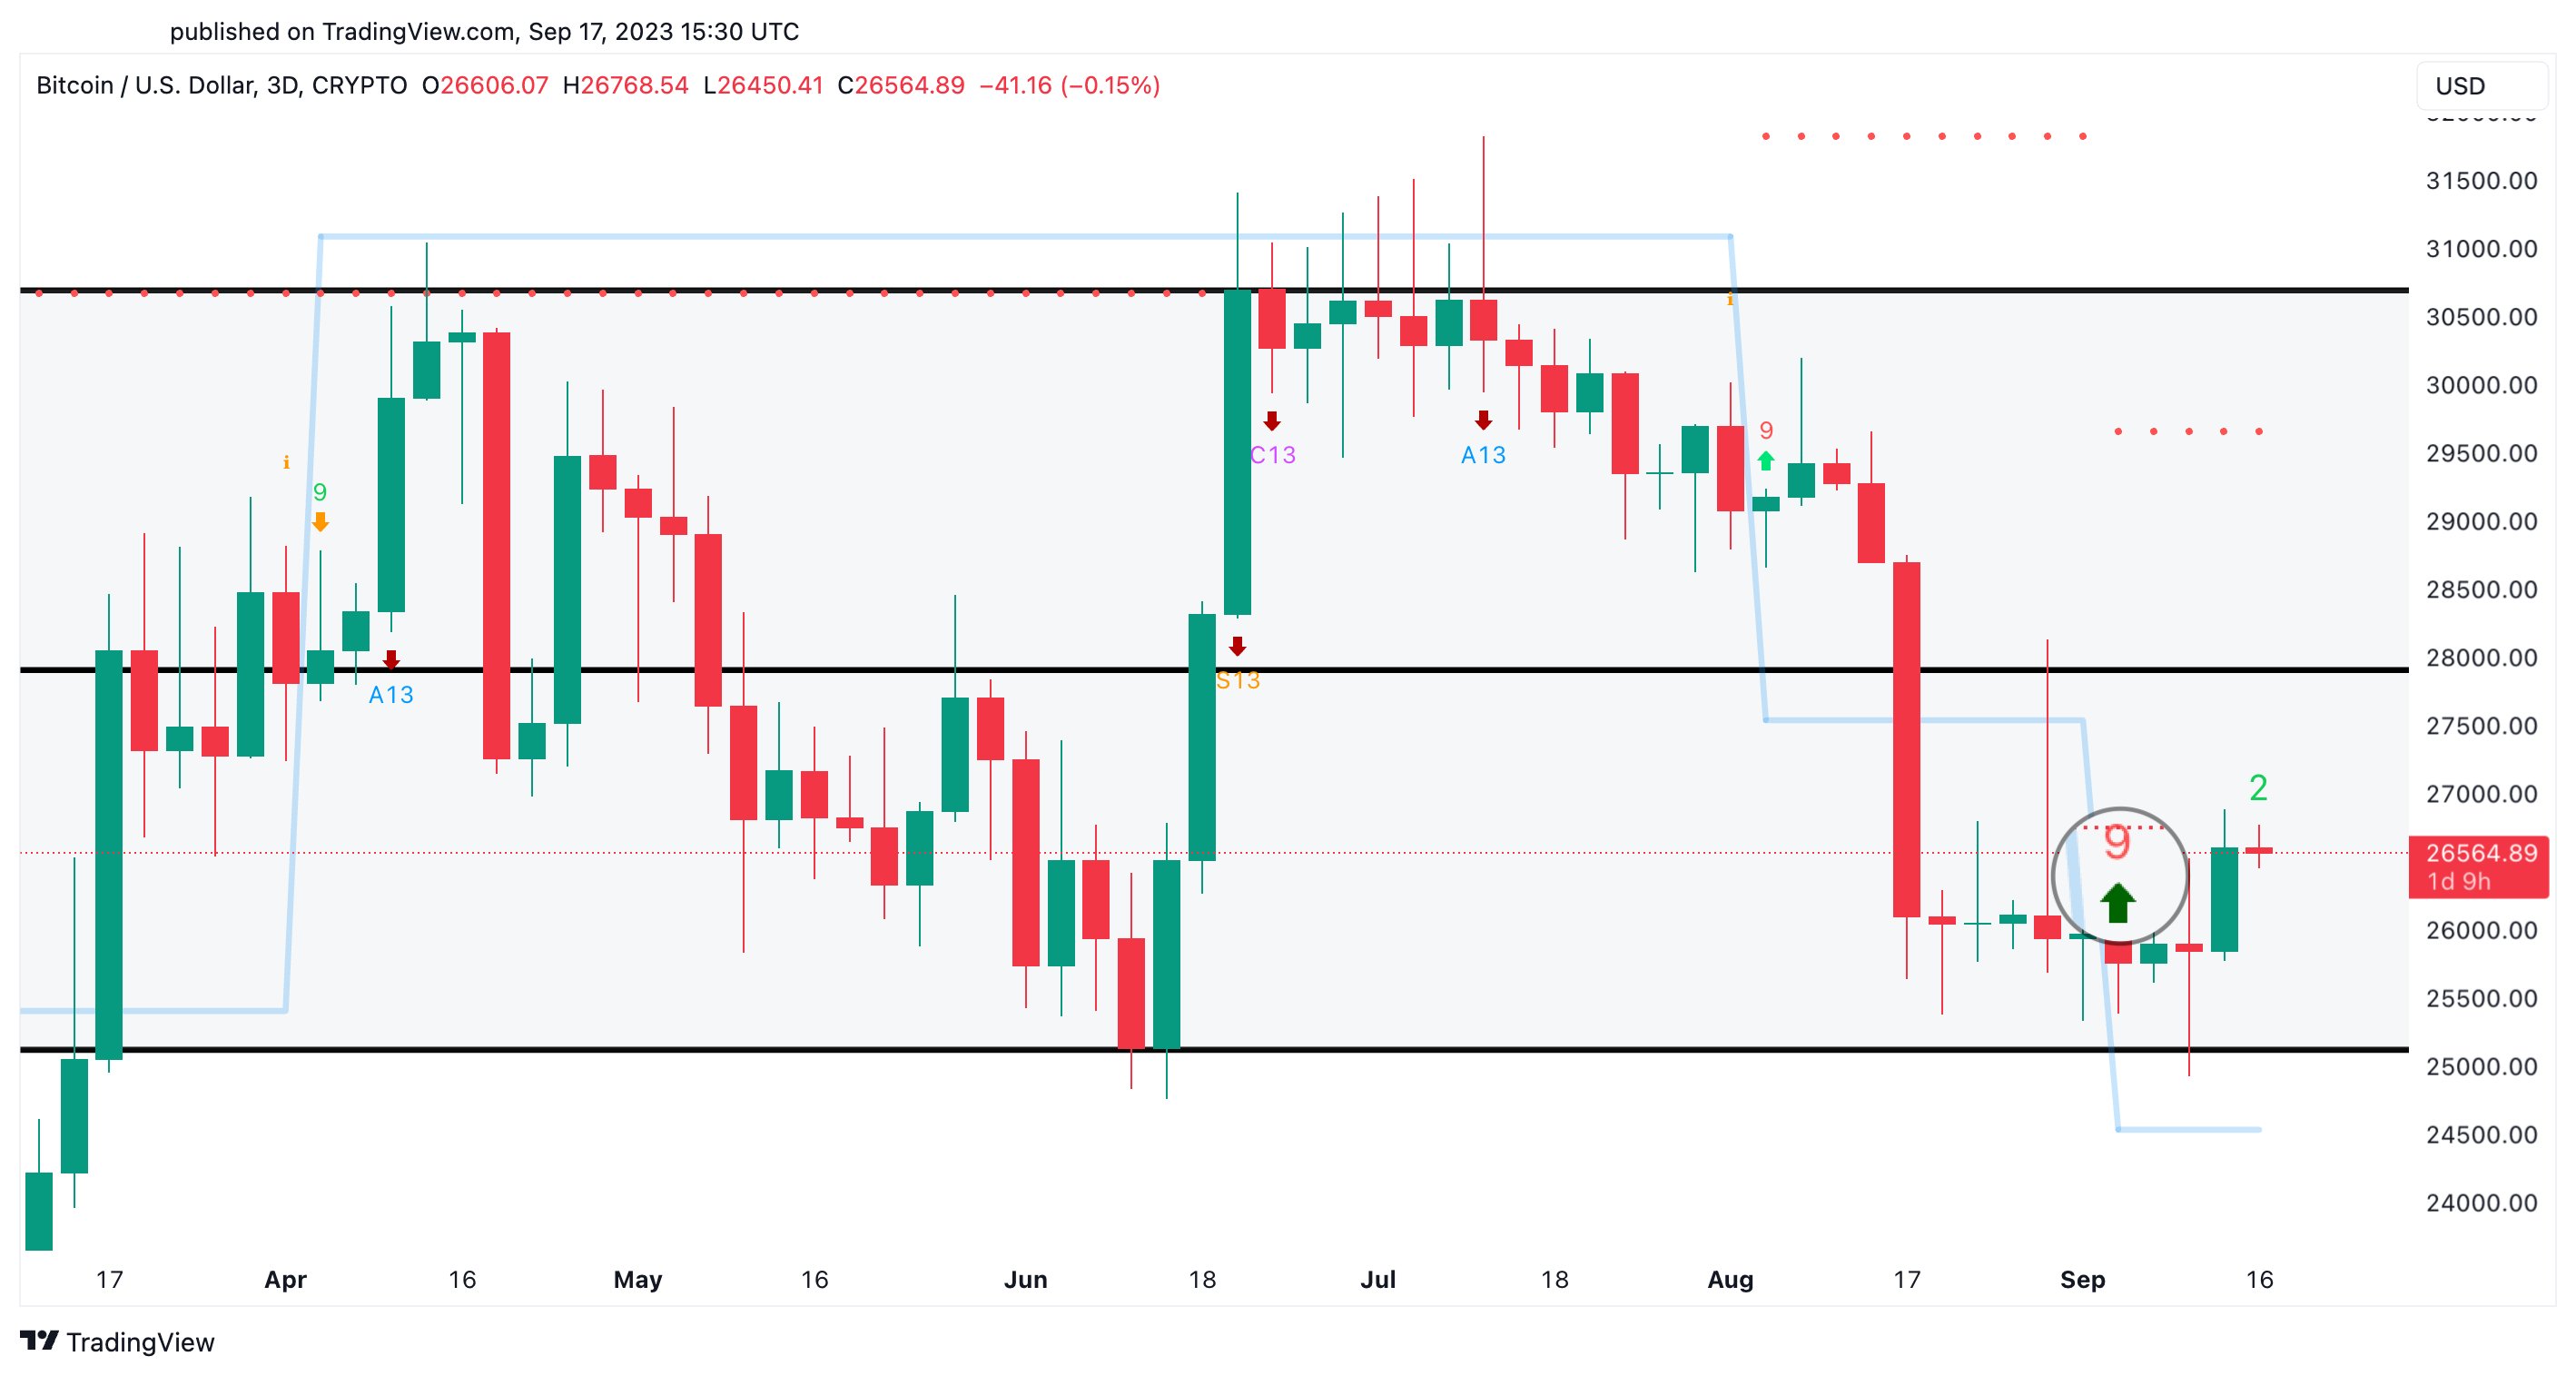
Ali Martinez, another analyst, pointed towards Bitcoin’s 3-day chart and noted a buy signal by the TD Sequential yesterday. “A boost in $BTC buying pressure might drive prices to the channel’s mid or upper boundary – targeting $28,000 or $31,000. Still, watch the TD Risk Line at $24,500. It’s the key invalidation point.”
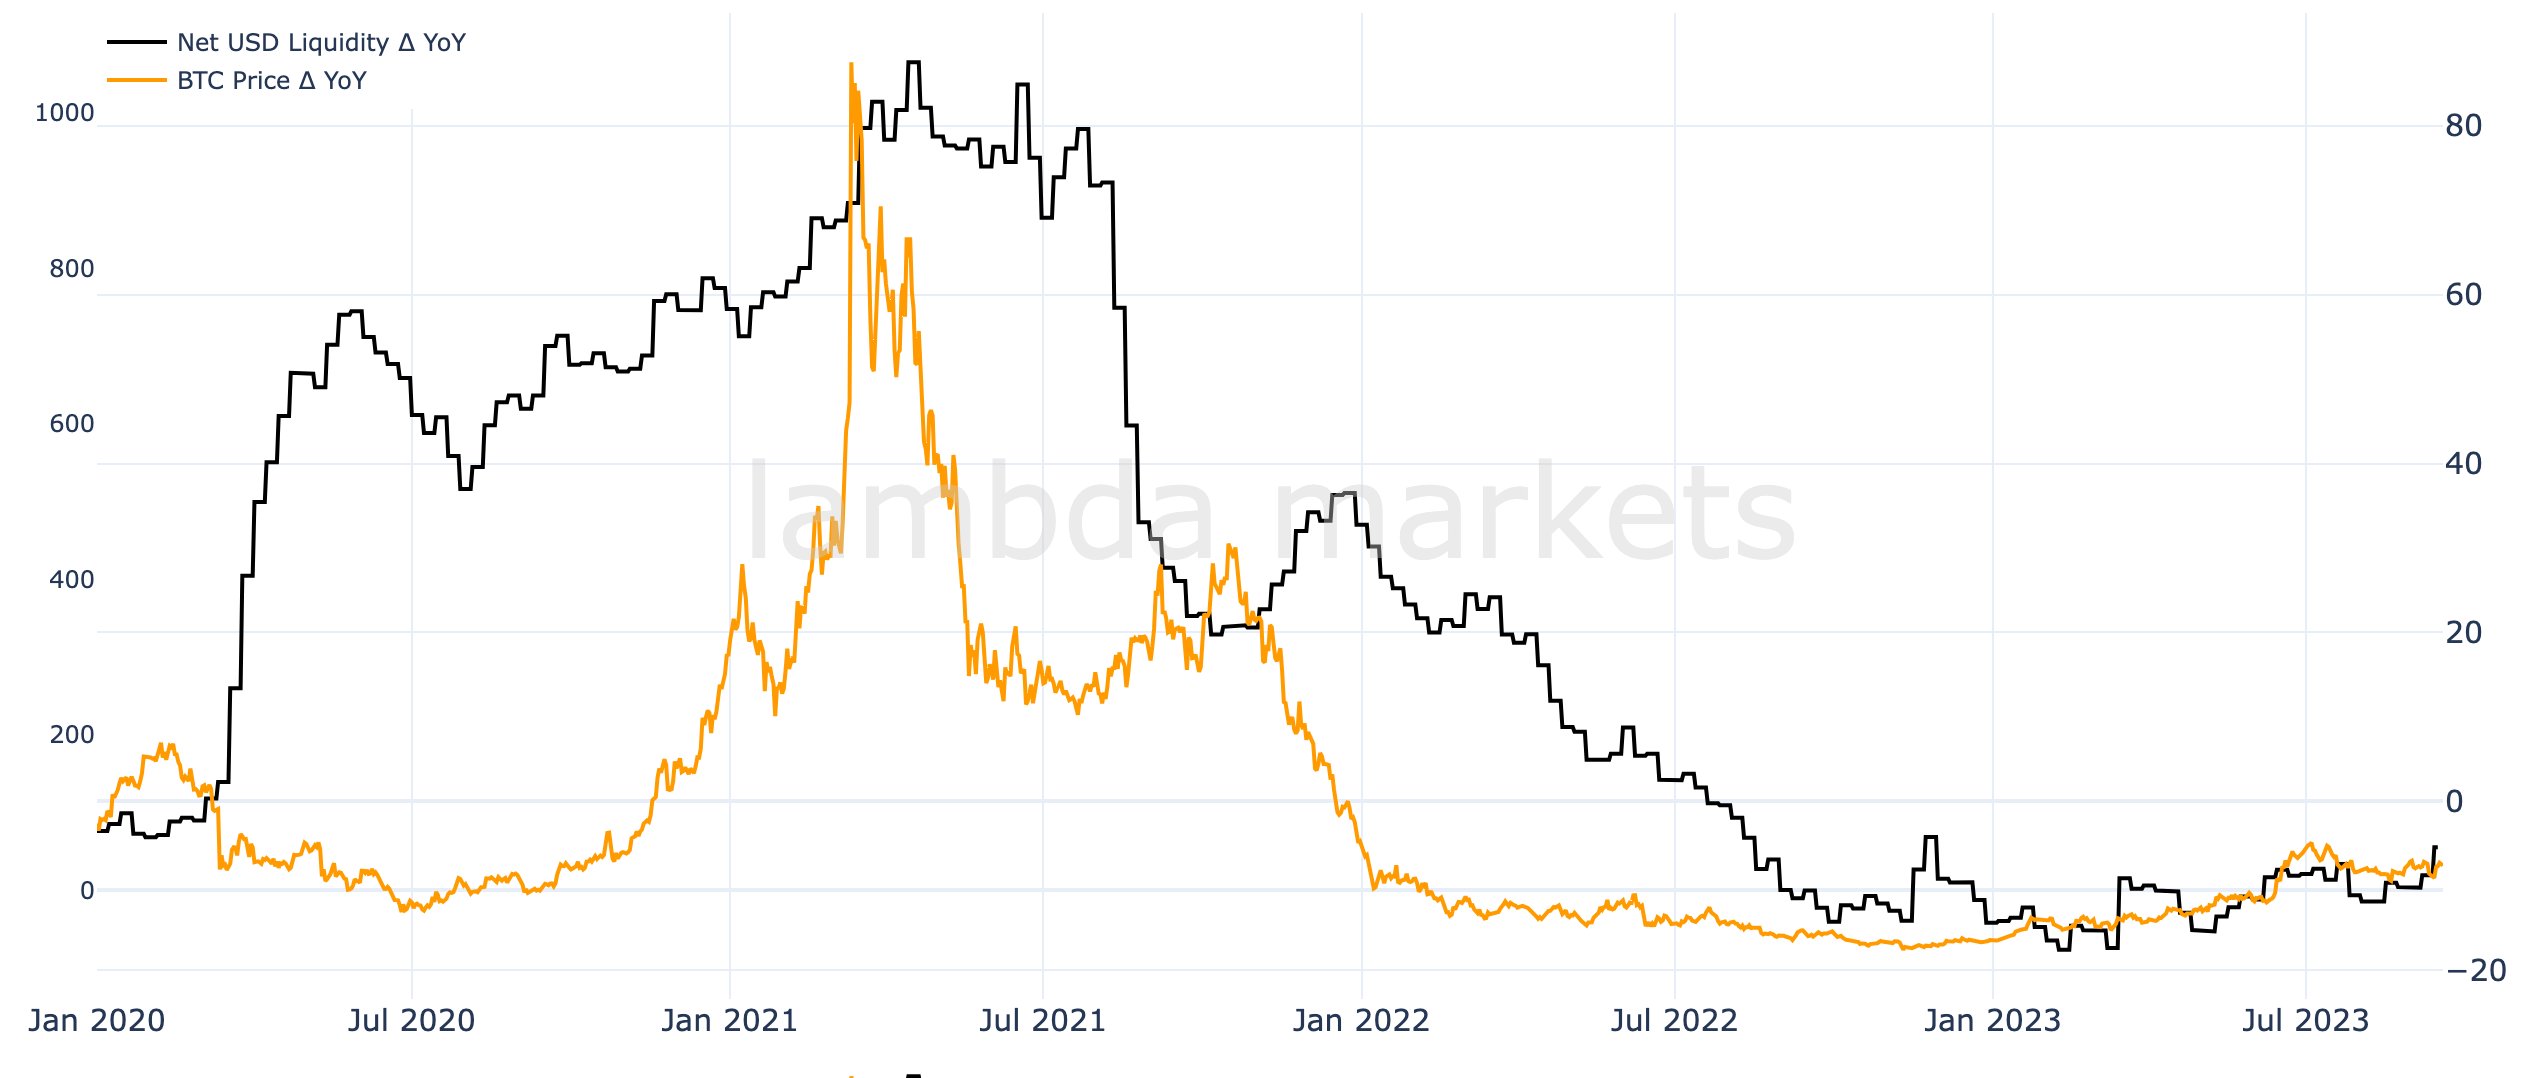
From macro perspective, renowned analyst Ted (@tedtalksmacro) indicated a correlation between USD liquidity and Bitcoin price movements: “If you can track/forecast USD liquidity, you’ll have a solid idea of where price is headed.” He went on to highlight a divergence between the rise in USD liquidity and the previous stagnation of BTC, emphasizing the recent shift which might be driven by returning liquidity.
Monthly Close Will Be Crucial
As NewsBTC reported, September is historically one of the worst months of the year for the Bitcoin price. However, this year could be different if BTC continues its trend of the last few days.
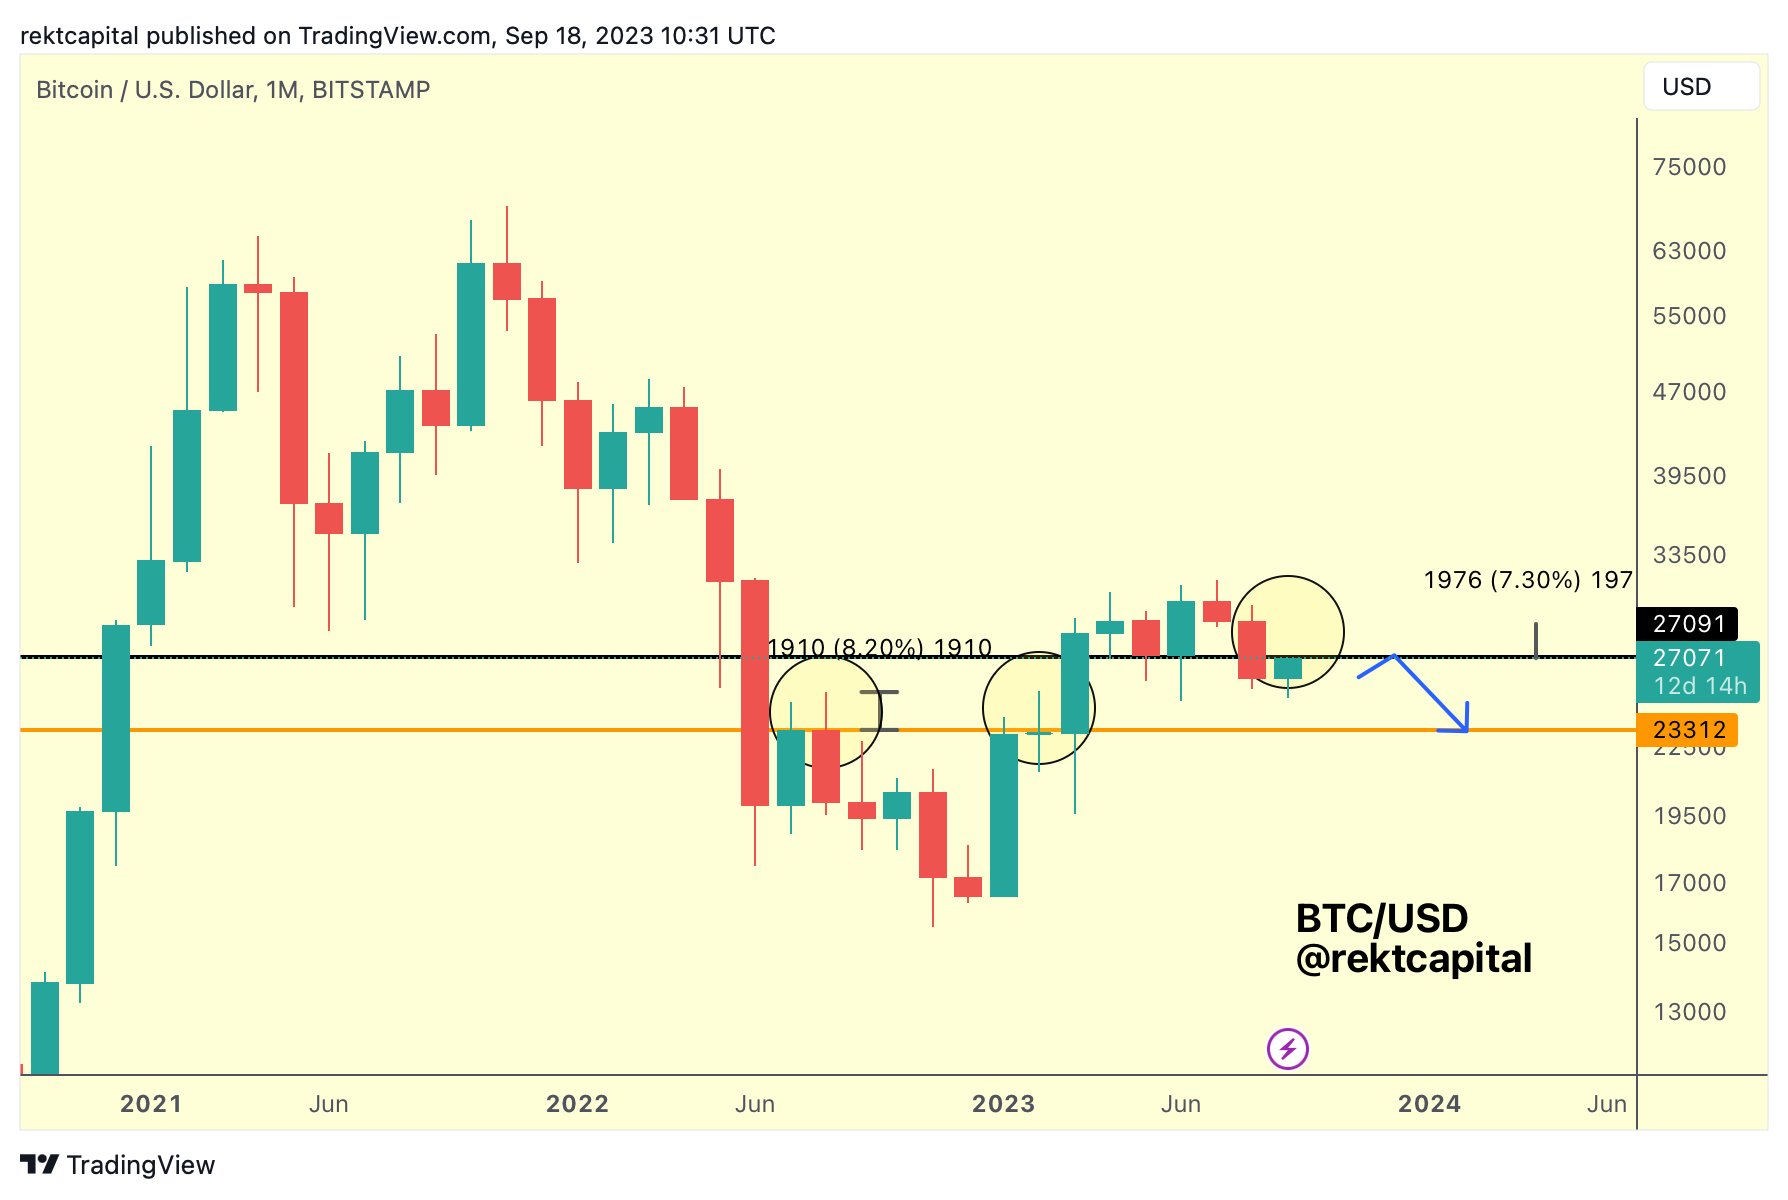
Rekt Capital highlighted the potential significance of the upcoming monthly candle close for Bitcoin in a recent tweet, stating: “The upcoming Monthly Candle Close will be pivotal.” According to the analyst, Bitcoin often produces long upward wicks when it transforms old Monthly supports into new resistances.
In simple terms, an upward wick on a candlestick chart indicates price levels where Bitcoin traded during a period but didn’t close. A long wick suggests a strong rejection from those higher price levels. This could mean that while buyers tried to push the price up during the month, by the close, sellers had brought it back down, leaving a long ‘wick’ on the candlestick.
Rekt Capital suggests that these wicks can extend up to +8% beyond the candle body. The analyst notes that if the monthly candle close produces an upside wick of +7% beyond the ~$27,100 level, it could mean the price might go beyond the weekly lower high.
This could be a positive sign if the monthly close remains above $27,100, indicating it as a support level. However, if the price closes the month below $27,100 after reaching higher levels, it may confirm $27,100 as a new resistance, hinting that the recent price movement might be just a temporary upward rally.
At press time, BTC stood at $27,241.
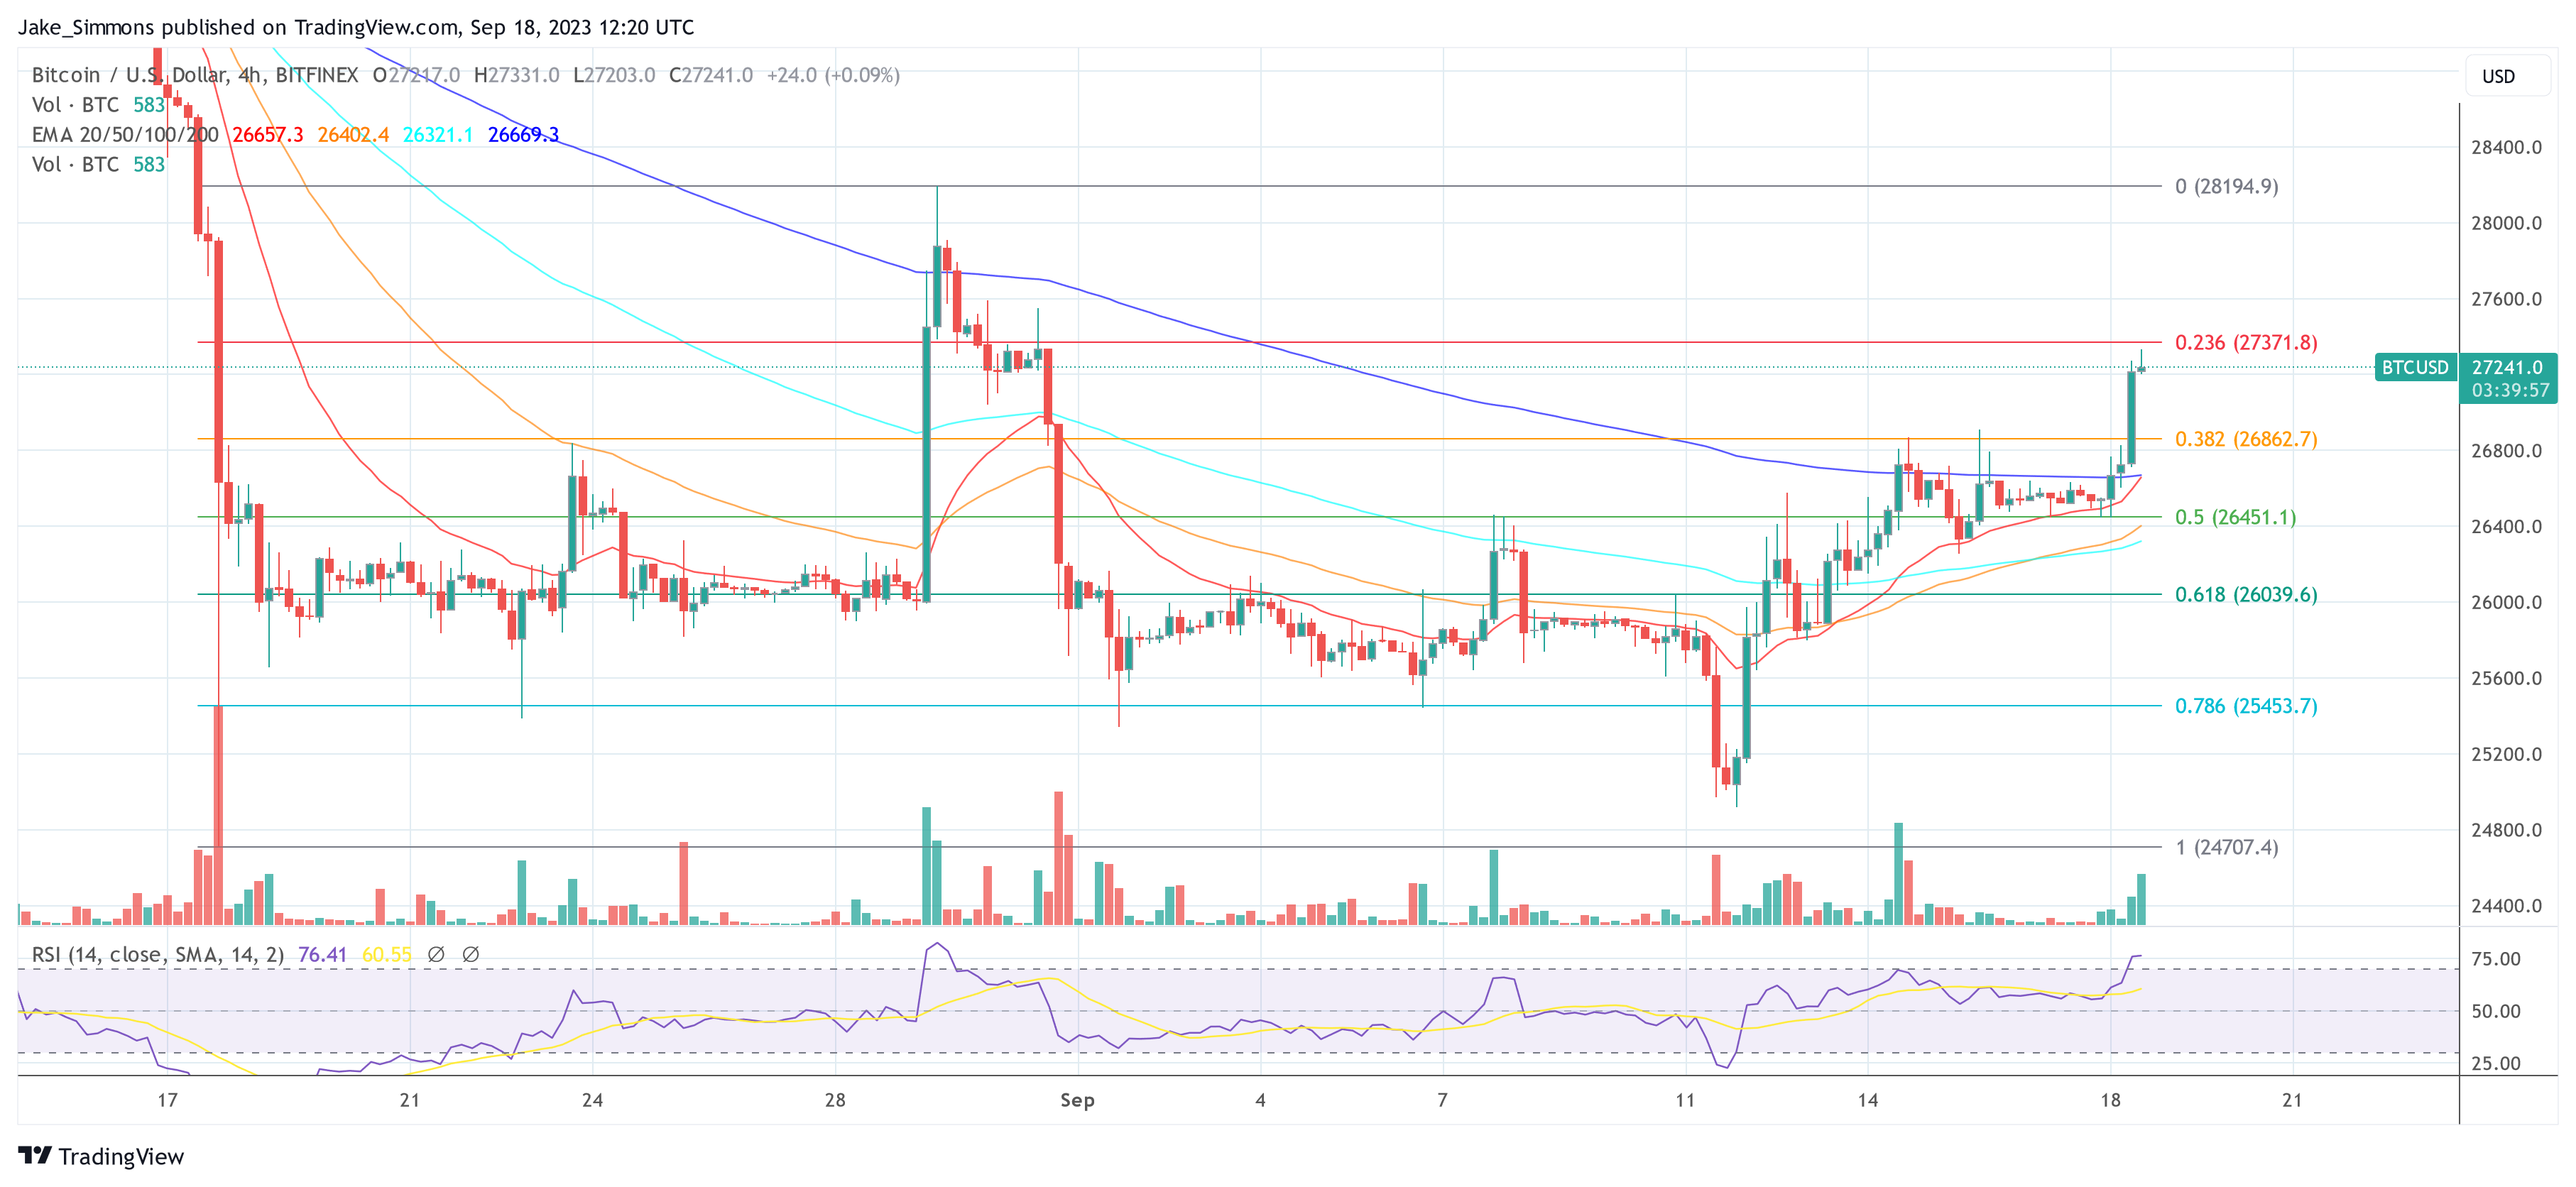
Featured image from iStock, chart from TradingView.com


