
Bitcoin (BTC) is on the brink of a significant price movement as it approaches the crucial resistance level of $64,515. The cryptocurrency asset has been experiencing an upward trend, gaining momentum and investor confidence.
Breaking through this key resistance could act as a catalyst for a major rally, potentially pushing BTC to new heights. Traders and market analysts are closely monitoring this level, as a successful breach could signal a strong bullish phase and attract increased trading activity, further driving up the price.
This article aims to provide an in-depth analysis of Bitcoin’s current price movement as it nears the significant resistance level of $64,515. It seeks to explore the potential market implications of breaking through this key threshold, including the likelihood of igniting a substantial rally.
Furthermore, it examines technical indicators, market sentiment, and historical data to offer readers a comprehensive understanding of what this resistance level means for Bitcoin’s long and short-term price trajectory.
With a market capitalization of more than $1.2 trillion and a trading volume of more than $21 billion as of the time of writing, the price of Bitcoin is currently down by 3.26%, trading at around $63,300 in the last 24 hours. BTC market cap and trading volume are currently up by 3.03% and 77.17% respectively.
Current Market Overview Of Bitcoin Upward Trend
Currently, on the 4-hour chart, the price of BTC is on a bullish rise and attempting a cross above the 100-day Simple Moving Average (SMA) with strong bullish momentum. Also, it can be noticed that the crypto asset has broken above the 4-hour bearish trend line.
The formation of the 4-hour Composite Trend Oscillator also signals bullishness for Bitcoin as both the signal line and the SMA of the indicator are attempting to cross above the zero line.
On the 1-day chart, the price of Bitcoin is experiencing a strong momentum rise toward the $64,515 resistance and the 1-day SMA. Specifically, this price increase started two days ago after a rejection at the $60,152 support level.
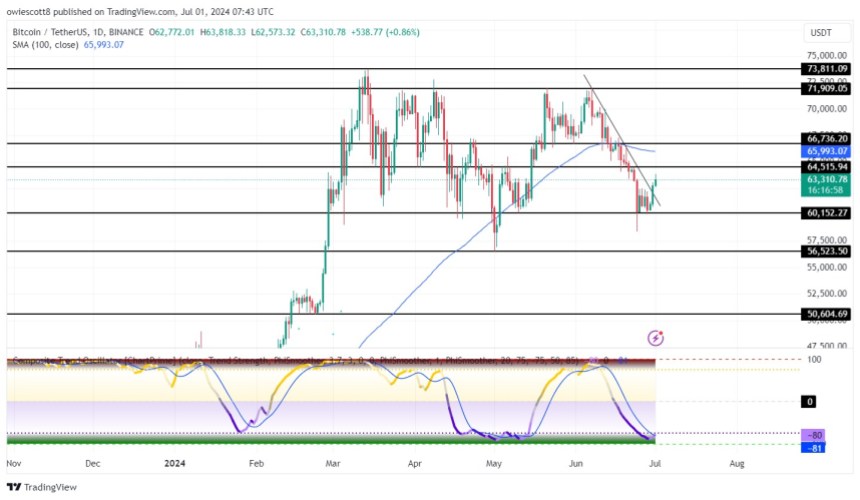
Finally, it can observed that the signal line of the 1-day Composite Trend Oscillator is attempting to cross above the SMA. This formation thereby indicates more bullishness for Bitcoin’s price.
Breaking Through Or Facing Rejection
Exploring possible market scenarios if Bitcoin breaks through or is rejected at $64,515 reveals that if the price of Bitcoin breaks above the $64,515 resistance level, it may continue to move upward toward the $66,736 resistance level. Should this level be breached, the crypto asset may experience more price growth toward the $71,909 resistance level and possibly other levels above.
Conversely, should Bitcoin’s price undergo a rejection at the $64,515 level and begin to drop again, it will continue its downward movement toward the $60,152 support level. Following a break below this level, BTC may experience a further price drop to test the $56,523 support level and probably other levels below.

Featured image from iStock, chart from Tradingview.com


