Bitcoin has observed some sharp price action today, and if data of these metrics is to go by, the asset may not be done being volatile just yet.
Bitcoin’s Open Interest And Leverage Ratio Have Remained High
As explained by an analyst in a CryptoQuant post, some metrics are forming a pattern that can lead to more volatility in the cryptocurrency’s price. These indicators are the open interest and the estimated leverage ratio.
The “open interest” refers to the total amount of Bitcoin futures contracts that are open on all derivative exchanges. An increase in this metric suggests that the investors are opening more positions on the futures market right now, while a decrease implies some of them are closing their positions, or are getting liquidated.
The other metric of interest here, the “estimated leverage ratio,” keeps track of the ratio between the open interest and the derivative exchange reserve (that is, the total amount of Bitcoin sitting in the wallets of these derivative platforms).
What this metric tells us is the amount of leverage that futures users are opting for on average. High leverage can significantly increase the risk of a large number of contracts being liquidated, so whenever this metric has a high value, the market can become more probable to show high volatility due to violent liquidation events.
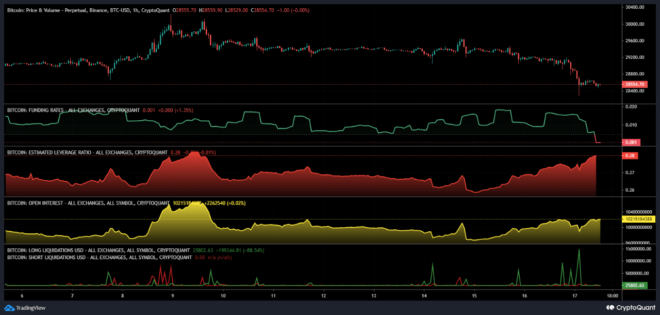
Now, here is a chart that shows the trend in these two Bitcoin indicators over the past few days:
Looks like both these metrics have observed high values in recent days | Source: CryptoQuant
As displayed in the above graph, the Bitcoin open interest and estimated leverage ratio had both been at relatively high values right before the plunge that the asset saw in the past 24 hours.
In this sharp price plummet, the futures market naturally observed a high amount of liquidations, leading to the open interest registering some decrease. The metric, however, didn’t actually see that much of a cool down despite these liquidations, and it has now already reached back to the same levels it was at before the volatility.
This would suggest that the futures market users have opened new positions since the mass liquidation event. While the open interest had gone down in this event, albeit briefly, the leverage ratio actually hadn’t budged even that much.
Rather, the indicator has only been going up, implying that the users opening up the new futures contracts are only opting for higher and higher amounts of leverage.
Because of the open interest rebounding and the leverage ratio only trending higher, it would appear like a reasonable possibility that the Bitcoin price would observe more volatility in the near future.
Such volatility can take the coin in either direction, but generally, the side of the market with the less amount of contracts is the more probable one.
In the chart, the data for the “funding rates” is attached, which basically tells us whether the longs or the shorts are dominant in the futures market currently.
The funding rates had been positive in the latest futures market overheat, as well as in the one seen earlier in the month, but following today’s long liquidations, the metric has turned negative. This may suggest that a liquidation event involving the shorts is more likely to happen next.
BTC Price
At the time of writing, Bitcoin is trading around $28,500, down 3% in the last week.

BTC has plunged during the past 24 hours | Source: BTCUSD on TradingView
Featured image from Kanchanara on Unsplash.com, charts from TradingView.com, CryptoQuant.com


