
Key points:
-
Bitcoin is attempting a recovery, but higher levels are likely to attract solid selling by the bears.
-
Several major altcoins are at risk of breaking below their support levels.
Bitcoin (BTC) bounced off the $86,000 level, but the bulls are struggling to sustain the higher levels. That shows selling on rallies.
Although analysts are divided about the near-term prospects of BTC, Binance co-founder Changpeng Zhao said in an interview with CNBC that BTC could witness a super cycle in the next 12 months.
In contrast, Bloomberg Intelligence strategist Mike McGlone said in an interview with Cointelegraph that BTC has put in a long-term top. He added that he doesn’t know where the bottom is but said “it is going to be like a low-price cure.”
However, several institutional investors have a different opinion as they believe that BTC is undervalued between $85,000 and $95,000. Coinbase said in its Charting Crypto Q1 2026 report that 80% of the surveyed institutional investors plan to either hold or add to their crypto positions on another 10% fall.
Could BTC and the major altcoins hold on to their support levels? Let’s analyze the charts of the top 10 cryptocurrencies to find out.
S&P 500 Index price prediction
The S&P 500 Index (SPX) rebounded sharply off the 50-day simple moving average (6,840) on Tuesday, indicating buying on dips.
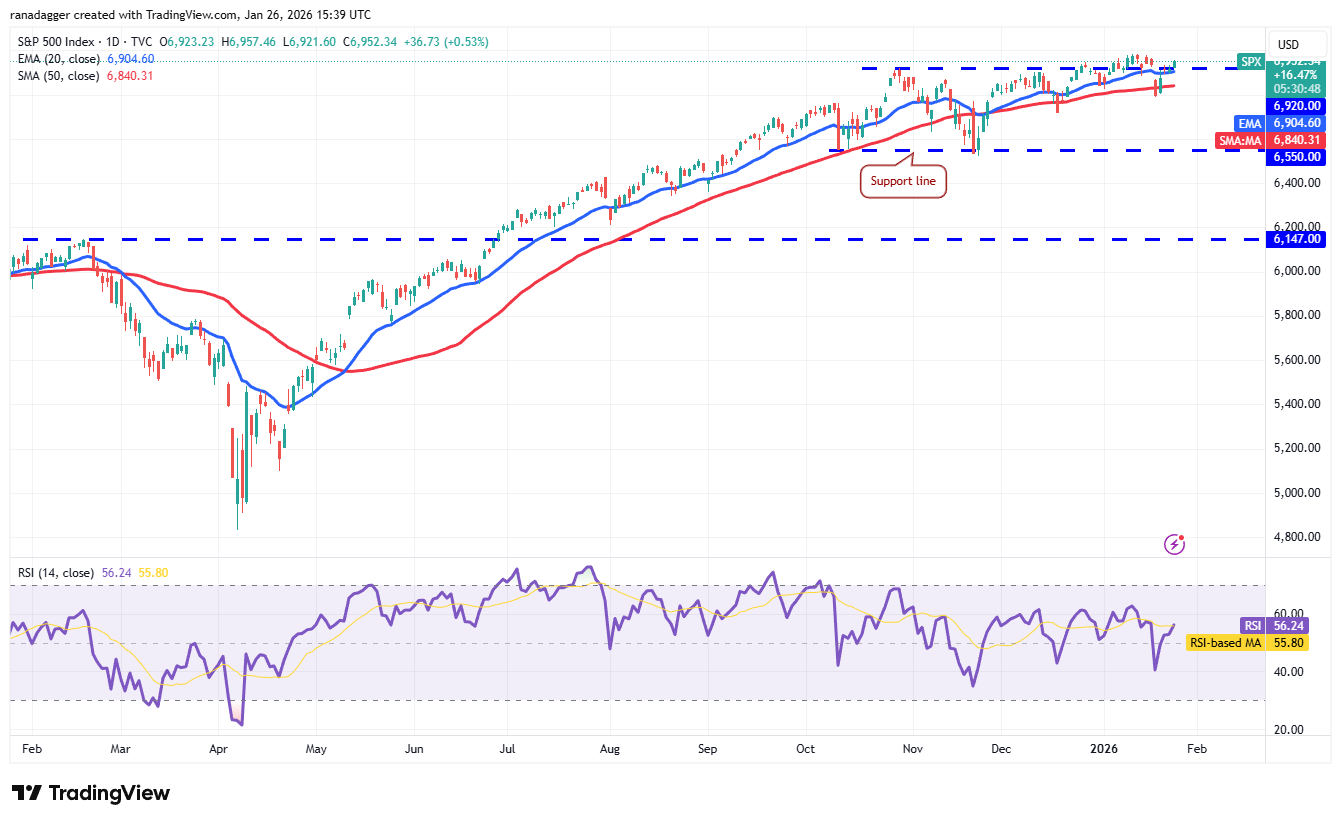
The 20-day exponential moving average (6,904) is flattening out, and the relative strength index (RSI) is just above the midpoint, indicating that the bullish momentum is weakening. Buyers will have to push the price above the 7,000 level to start the next leg of the uptrend toward 7,290.
Sellers are likely to have other plans. They will attempt to pull the price below the 50-day SMA, starting a deeper correction toward 6,720.
US Dollar Index price prediction
The US Dollar Index (DXY) slipped below the moving averages on Tuesday and the 97.74 support on Friday.
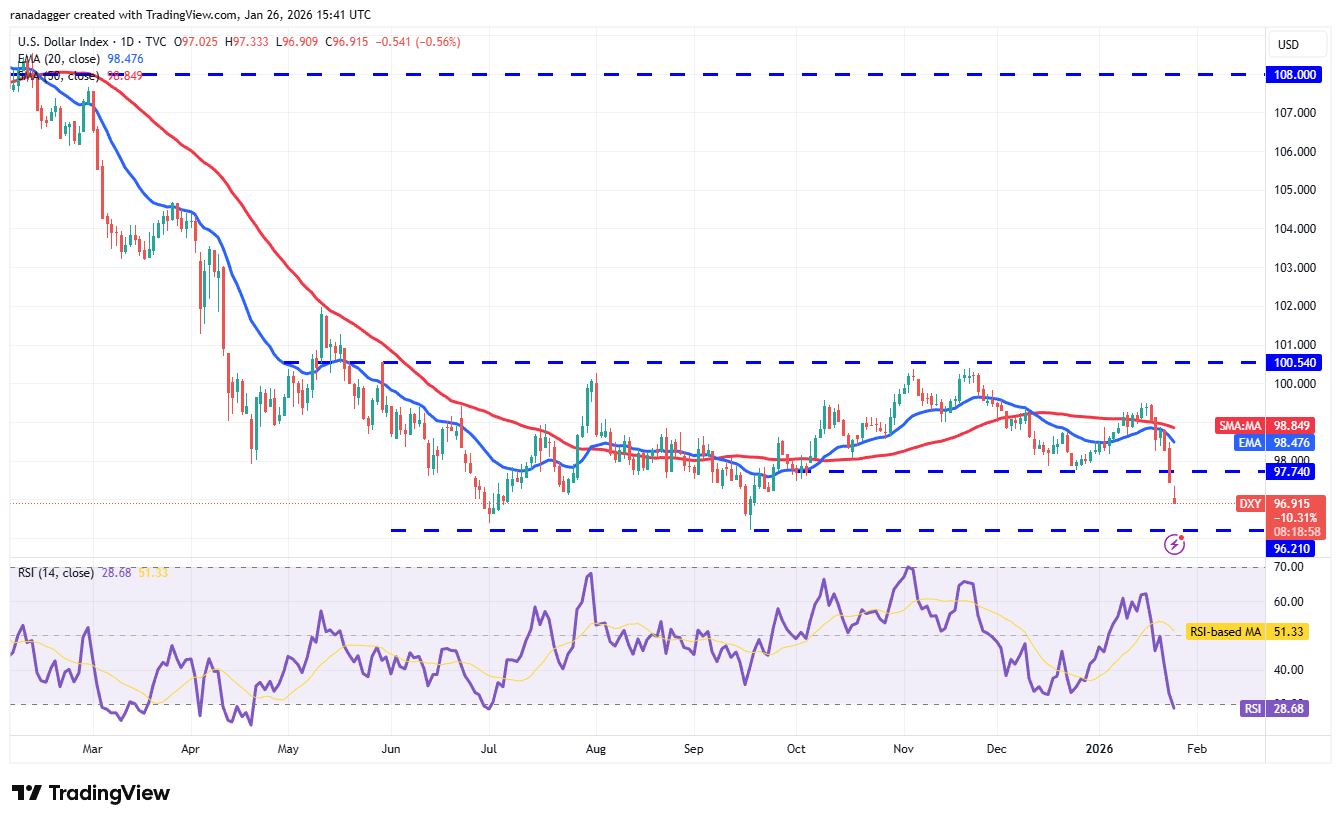
Sellers will attempt to yank the price to the solid support at 96.21, which is a critical level to watch out for. If the support gives way, the index may resume the downtrend toward the 94.62 level.
Buyers have an uphill task ahead of them. They will have to thrust the price above the moving averages to keep the index range-bound between 96.21 and 100.54 for a while longer.
Bitcoin price prediction
BTC turned down from the 20-day EMA ($90,521) on Friday and plunged below the uptrend line on Sunday.
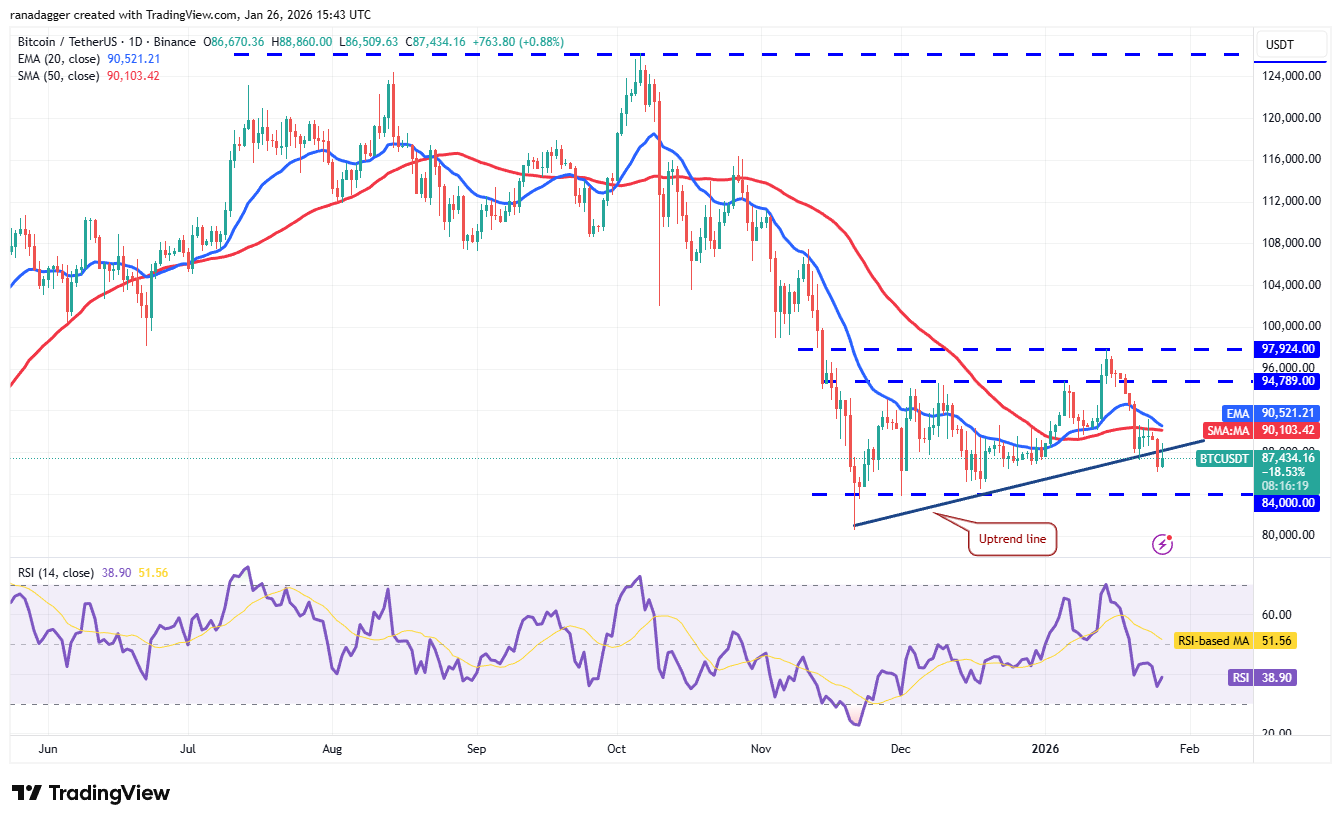
The 20-day EMA has started to turn down, and the RSI is in the negative zone, signaling advantage to bears. Any recovery attempt is expected to face selling at the moving averages. If the price turns down from the moving averages, the BTC/USDT pair may plunge to $84,000 and then to $80,600.
This negative view will be invalidated in the near term if the Bitcoin price turns up and breaks above the moving averages. The pair may surge to the $97,924 overhead resistance.
Ether price prediction
Ether’s (ETH) symmetrical triangle pattern resolved to the downside with a break below the support line on Sunday.
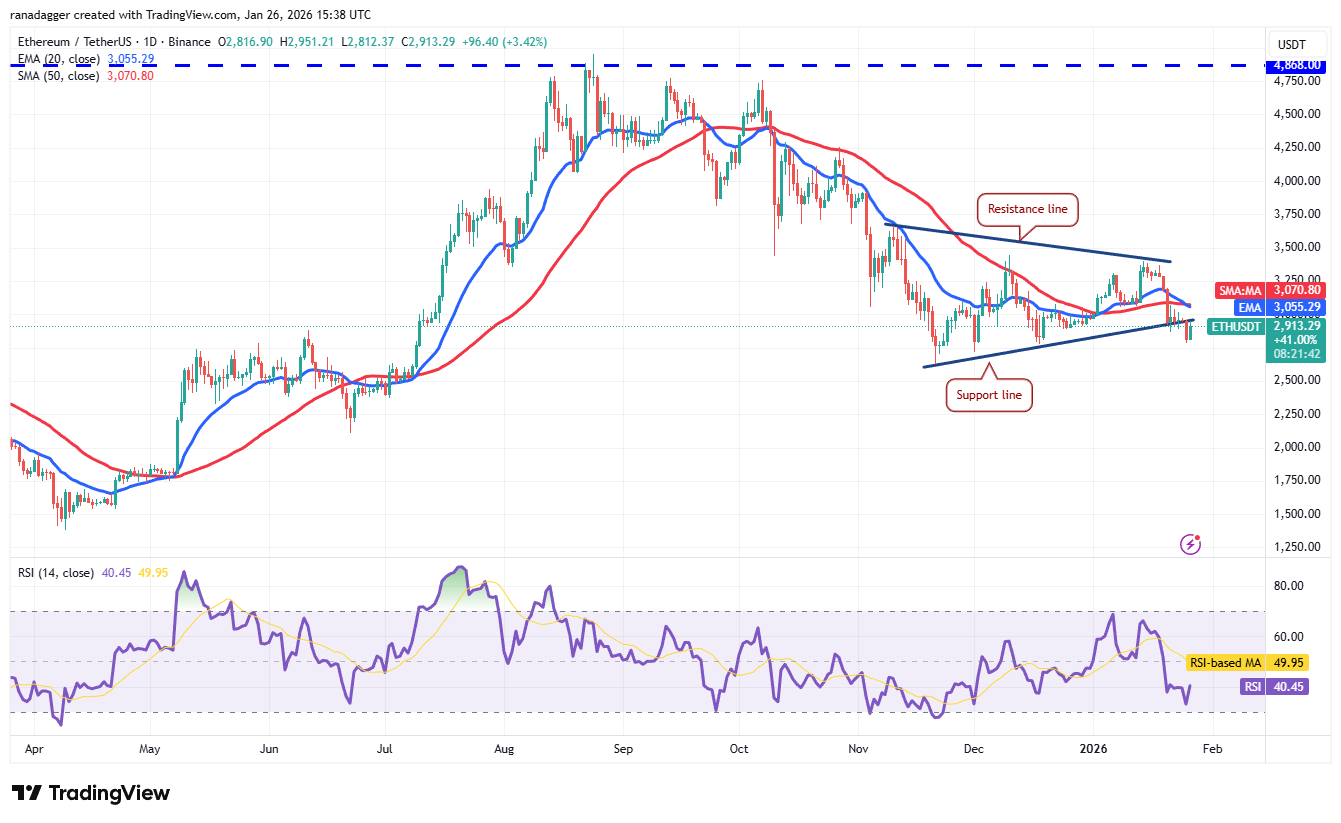
Buyers will attempt to push the Ether price back into the triangle, but are expected to face significant resistance from the bears. If the price turns down sharply from the moving averages, the likelihood of a drop to $2,623 increases.
The bulls will have to quickly push the price back above the moving averages to suggest that the break below the triangle may have been a bear trap. The ETH/USDT pair may surge to the resistance line of the triangle.
XRP price prediction
XRP (XRP) has been gradually falling inside the descending channel pattern, signaling that the bears remain in control.
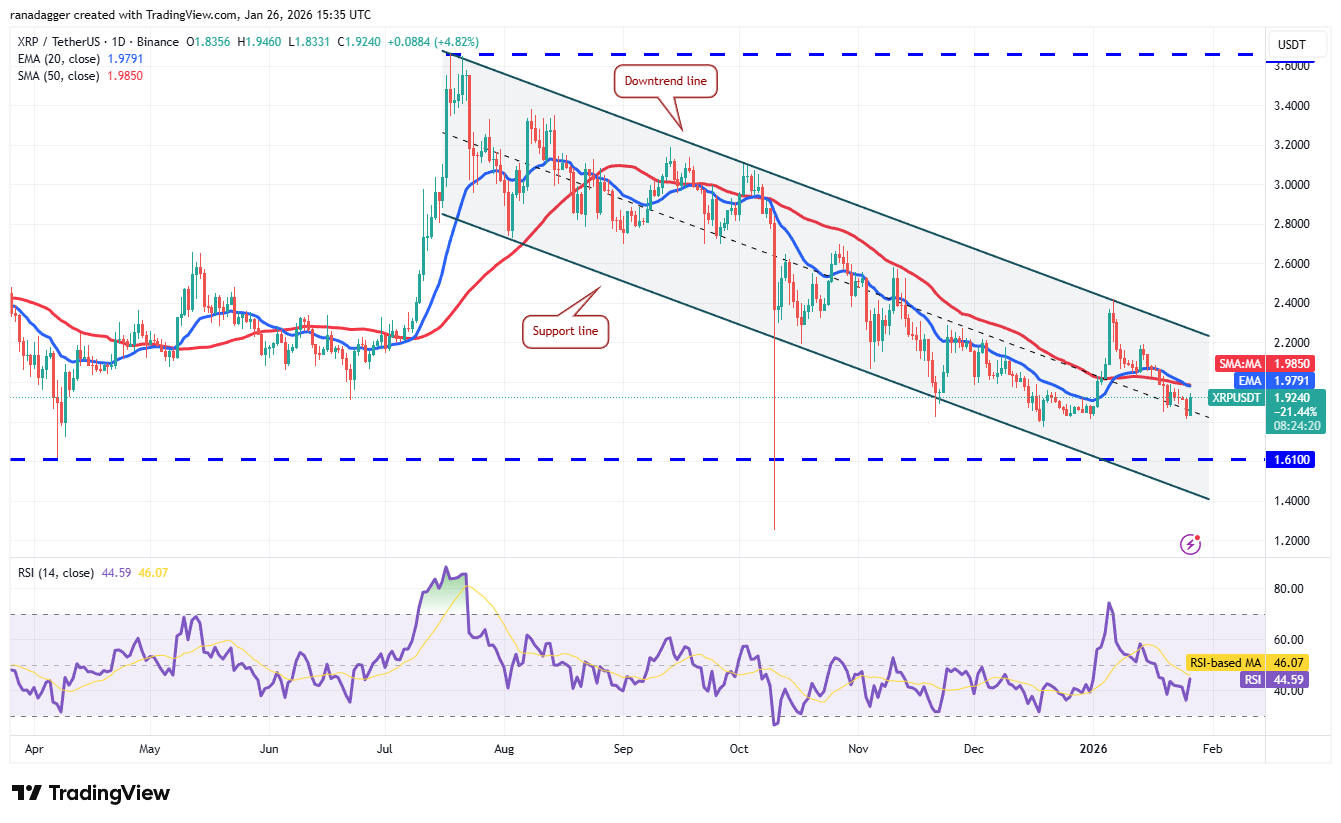
There is support at $1.81, but the relief rally is likely to face selling at the 20-day EMA ($1.97). If the price turns down sharply from the 20-day EMA, the XRP/USDT pair may tumble to the solid support at $1.61.
On the contrary, if the XRP price breaks above the moving averages, the recovery may reach the downtrend line. A close above the downtrend line suggests a potential trend change in the near term.
BNB price prediction
BNB (BNB) closed below the 50-day SMA ($883) on Sunday, indicating that the bulls are losing their grip.
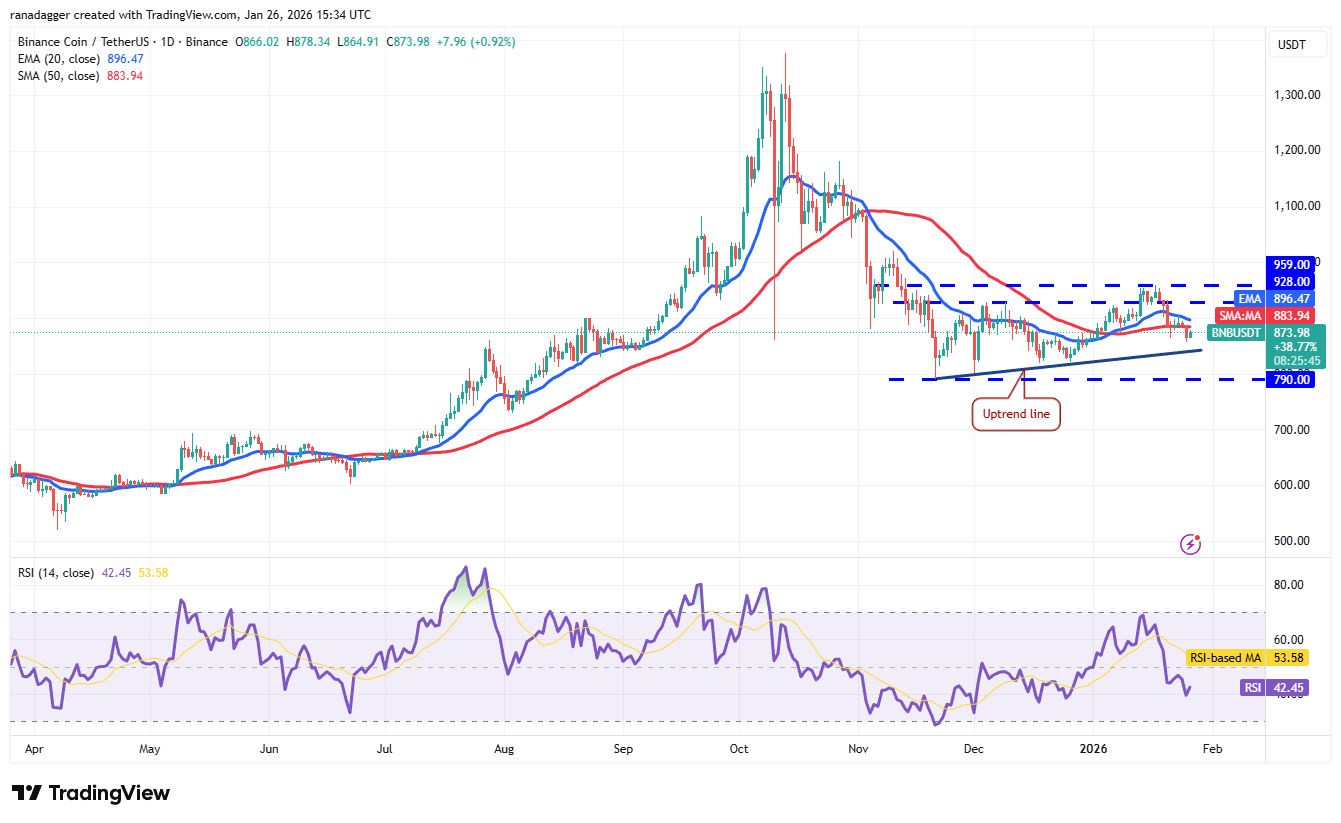
The rebound off the uptrend line is expected to face selling at the 20-day EMA ($896). If the BNB price turns down from the 20-day EMA, it increases the possibility of a drop to the $790 support. Buyers will have to defend the $790 level with all their might, as a close below it could resume the downtrend.
The first sign of strength will be a close above the moving averages. The BNB/USDT pair may then ascend to the $959 overhead resistance.
Solana price prediction
Solana (SOL) bounced off the $117 support on Monday, indicating that the bulls are defending the level.
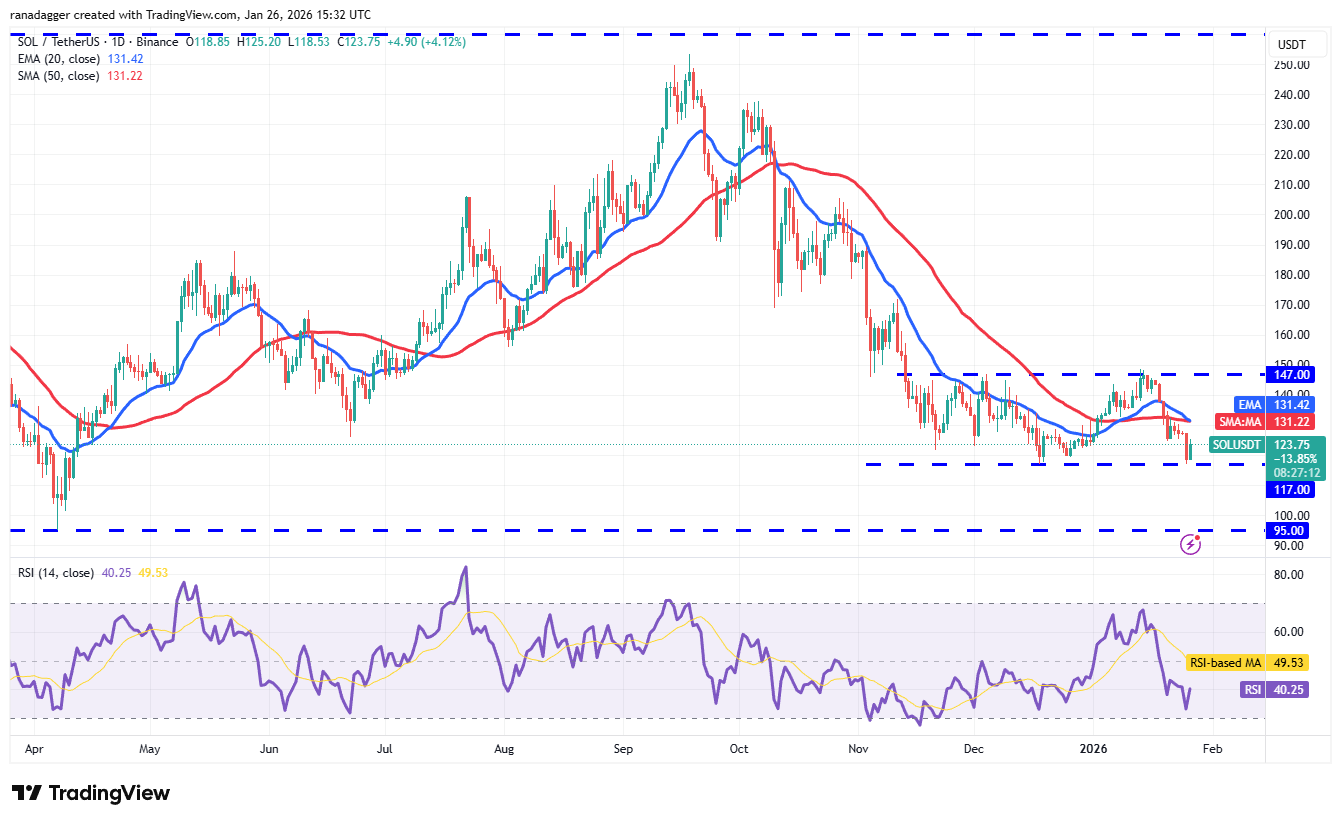
The relief rally is expected to face selling at the 20-day EMA ($131). If the price turns down sharply from the 20-day EMA, the risk of a break below the $117 level increases. The SOL/USDT pair may then plunge toward the solid support at $95.
Contrary to this assumption, if the Solana price turns up and breaks above the moving averages, it signals that the pair may continue to oscillate inside the $117 to $147 range for some more time.
Related: Bitcoin Coinbase Premium stays deeply negative: Is $66K BTC price next?
Dogecoin price prediction
Buyers are attempting to maintain Dogecoin (DOGE) above the $0.12 level, but the bears continue to exert pressure.
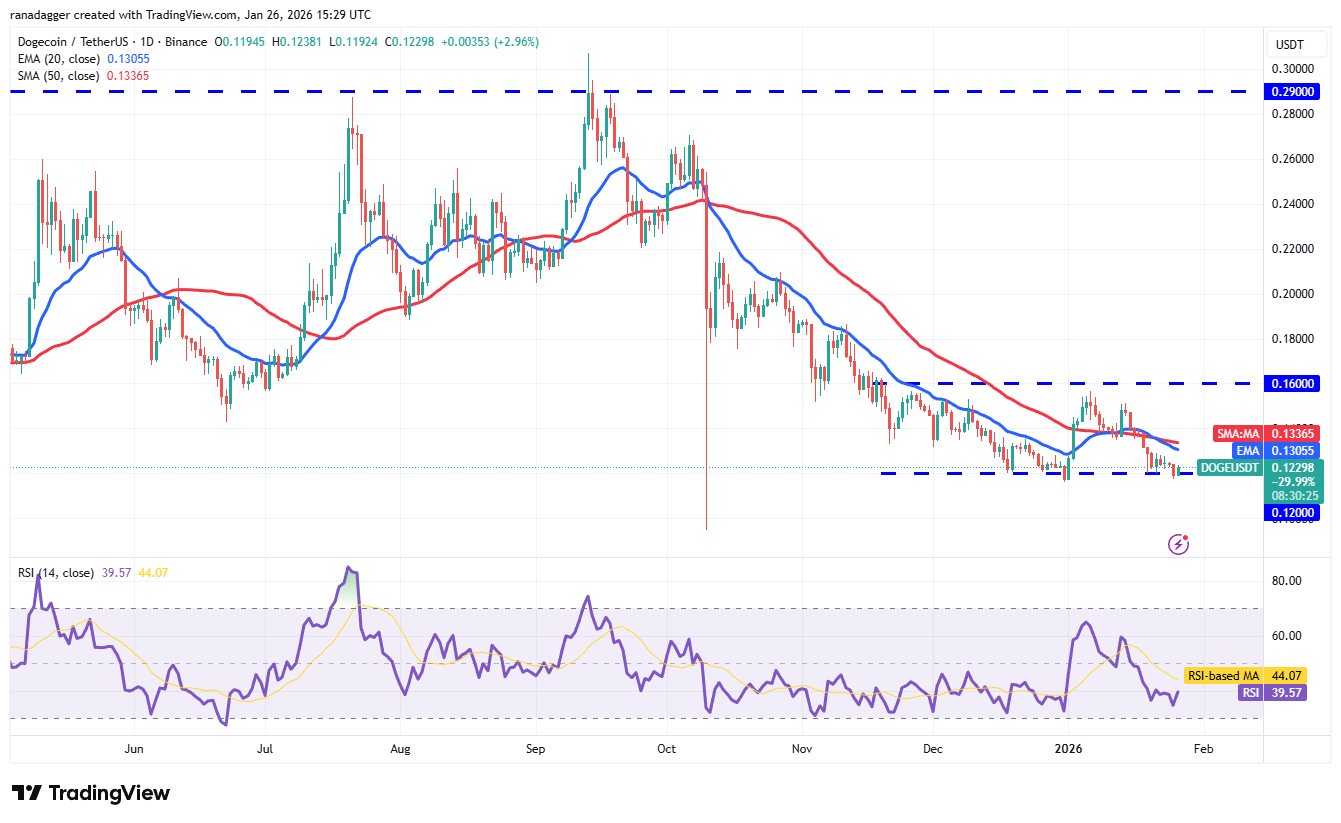
If the $0.12 support gives way, the DOGE/USDT pair may start the next leg of the downward move to the Oct. 10, 2025, low of $0.10.
If the price rebounds off the current level, the bears will attempt to halt the recovery at the moving averages. If that happens, the possibility of a break below the $0.12 level increases. Buyers will have to drive the Dogecoin price above the moving averages to retain the pair inside the $0.12 to $0.16 range.
Cardano price prediction
Cardano (ADA) has turned up from the $0.33 support, which is a critical near-term level to watch out for.
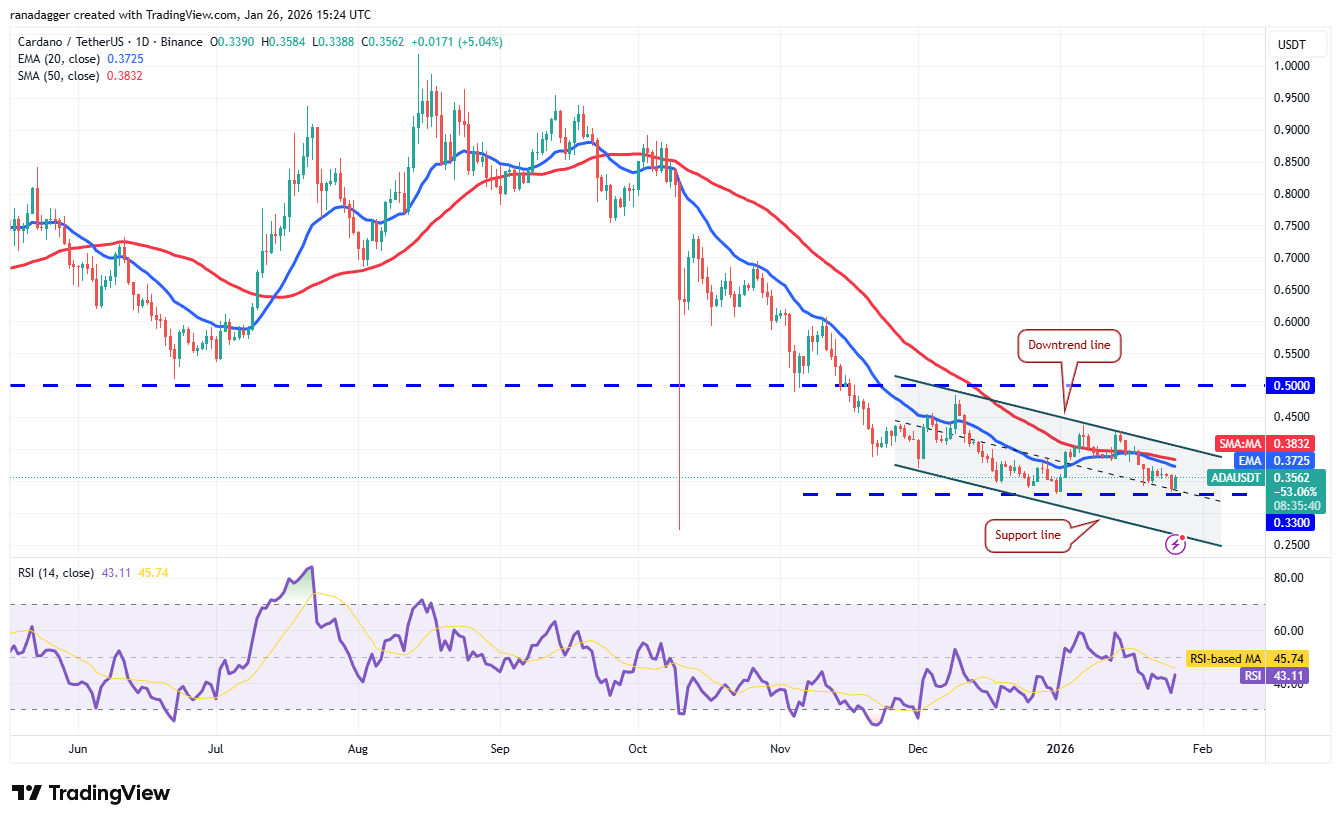
Buyers will have to swiftly propel the Cardano price above the downtrend line to signal strength. The ADA/USDT pair may then climb to the breakdown level of $0.50, which is expected to pose a strong challenge to the bulls.
Sellers will strive to halt the recovery at the downtrend line. If the price turns down from the overhead resistance, the bears will again attempt to tug the pair below $0.33. If they succeed, the next stop is likely to be the support line of the descending channel pattern, which is close to the Oct. 10, 2025, low of $0.27.
Bitcoin Cash price prediction
Bitcoin Cash (BCH) turned down sharply from the 20-day EMA ($596) on Sunday, but a minor positive is that the bulls held the $563 level.
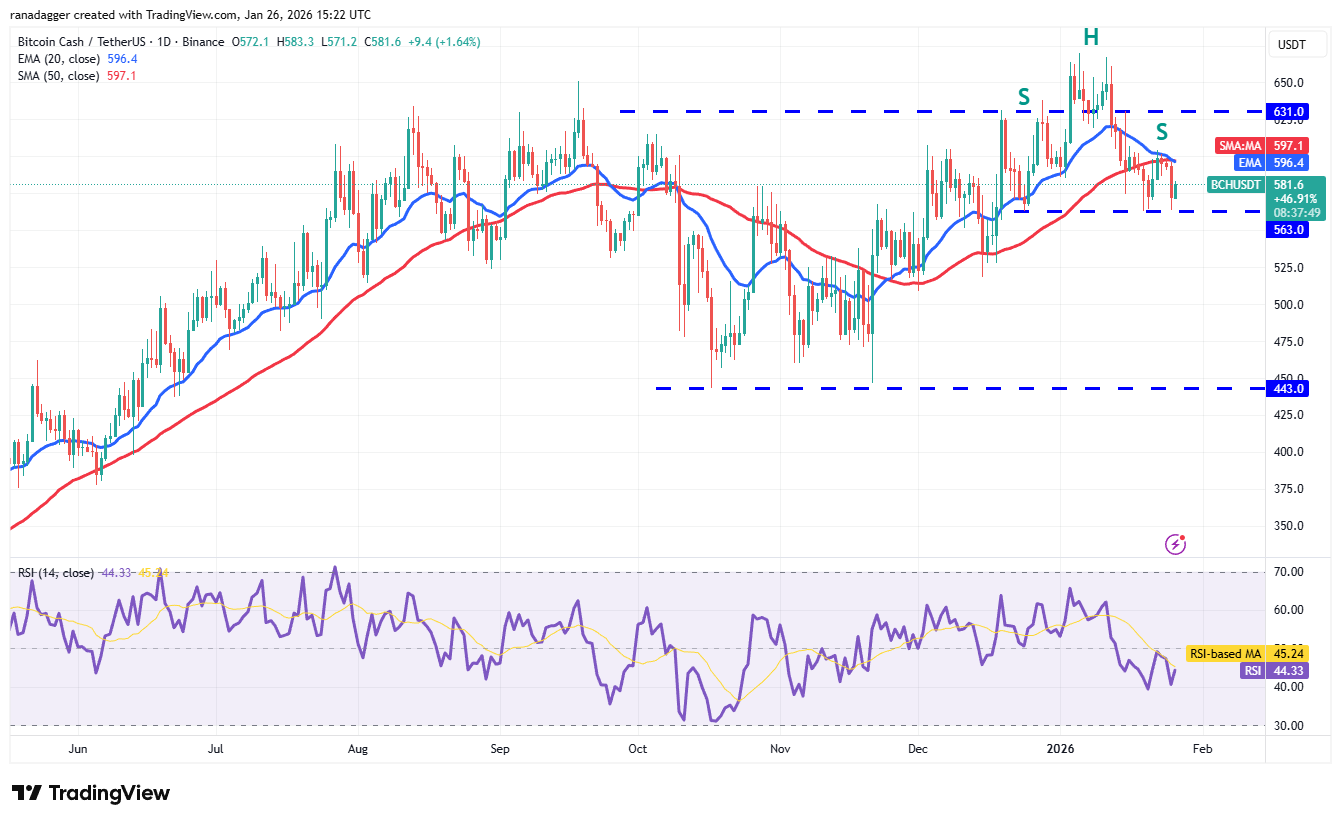
The downsloping 20-day EMA and the RSI in the negative territory suggest that the bears will again attempt to sink the Bitcoin Cash price below the $563 support. If they manage to do that, the BCH/USDT pair will complete a bearish head-and-shoulders pattern. The pair may then plunge to $518.
Contrarily, if buyers drive the price above the moving averages, the pair could rally to $631. Sellers are expected to fiercely defend the zone between $631 and $670.
This article does not contain investment advice or recommendations. Every investment and trading move involves risk, and readers should conduct their own research when making a decision. While we strive to provide accurate and timely information, Cointelegraph does not guarantee the accuracy, completeness, or reliability of any information in this article. This article may contain forward-looking statements that are subject to risks and uncertainties. Cointelegraph will not be liable for any loss or damage arising from your reliance on this information.


