
Decentraland (MANA) is at a critical juncture as it faces a key trendline retest that could determine its next major move. With the price hovering near a crucial support level, market watchers are keen to see whether MANA will hold the line and spark a bullish reversal.
A successful defense of this trendline could trigger an upsurge, propelling the cryptocurrency to new highs. However, failure to hold could lead to increased volatility and uncertainty. All eyes are now on MANA’s ability to withstand the pressure and potentially set the stage for a significant breakout.
This article aims to examine MANA’s critical trendline retest and its potential to ignite a bullish upsurge. We will explore the technical factors at play, assess key support and resistance levels, and consider the market sentiment driving this pivotal moment, providing traders and investors with insights into whether MANA is poised for a breakout or if a reversal is on the horizon.
Market Sentiment: Are Bulls Ready To Take Charge?
MANA’s price is currently trading below the 100-day Simple Moving Average (SMA) on the 4-hour chart, with a clear attempt to retest bearish territory. This price action indicates that bearish forces remain dominant in the market and could push the price further down toward the key trendline support level.
Additionally, on the 4-hour chart, the Relative Strength Index (RSI) has fallen below the 50% mark, now sitting at 33%. With the RSI hovering in the lower range, there is a heightened likelihood that the price may continue to lose ground, potentially moving toward a critical trendline retest.
On the daily chart, MANA has been on a bearish trajectory, moving to retest the trendline after briefly trading above it and below the 100-day SMA, as evidenced by multiple bearish candlesticks. This downward movement reflects strong selling pressure and negative market sentiment, increasing the probability of the price reaching the trendline again.
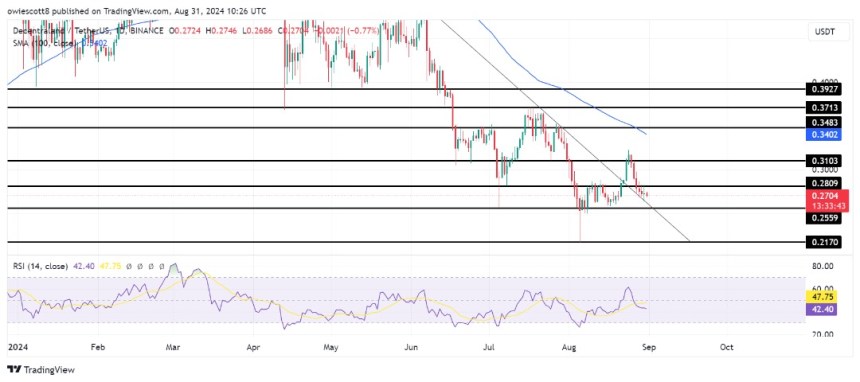
Finally, the 1-day RSI shows bearish pressure on MANA. The signal line has dropped below 50%, now resting at 45%, which signals intensifying selling pressure and a growing negative sentiment for the digital asset.
Support Vs. Resistance: What’s Next For MANA?
If MANA’s price reaches the bearish trendline and faces a rejection, it could set the stage for a significant upsurge, and $0.3103 could be the next resistance zone. A successful breakout above this resistance could signal further gains reinforcing the bullish trend aiming at the next resistance range at $0.3483 and other levels beyond.
Should MANA fail to hold below the bearish trendline, it may experience consolidation or fall back to the $0.2559 support level. When the price breaks through this support, it could continue its downtrend, possibly targeting $0.2170 and other lower support levels.
Currently, MANA is trading around $0.2792, marking a 3.7% decline. The cryptocurrency’s total market capitalization stands at $518 million, with a trading volume of $27 million in the last 24 hours. During this period, MANA’s market cap has decreased by 3.10%, and its trading volume has increased by 14.80%.

Featured image from LinkedIn, chart from Tradingview.com


