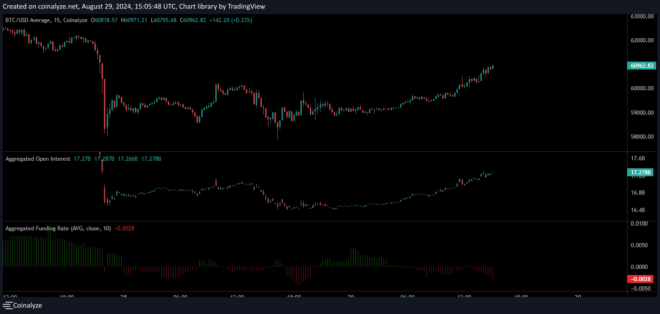
Data shows the Bitcoin Open Interest on exchanges has been heading up while the Funding Rate has turned negative recently.
Bitcoin Open Interest Trend Suggests Speculators Are Back
As pointed out by CryptoQuant community manager Maartunn in a new post on X, things appear to be heating up on the derivatives side of the market. There are two indicators of relevance here: Open Interest and Funding Rate.
Related Reading
The first of these, the Open Interest, keeps track of the total amount of derivatives contracts related to Bitcoin, whether short or long positions, that are currently open on all exchanges.
When the value of this metric goes up, it means the investors are opening up fresh positions on the market right now. As new positions generally come with an increase in the overall leverage present in the sector, this kind of trend can lead to higher volatility for the asset.
On the other hand, the indicator’s value observing a decline implies investors either are closing up positions of their own volition or are getting liquidated by their platform. The coin’s price may become more stable following this trend.
Now, here is a chart that shows the trend in the Bitcoin Open Interest over the past few days:
As displayed in the above graph, the Bitcoin Open Interest had taken a plunge earlier as a result of the cryptocurrency’s decline towards the $58,000 level, which had induced the liquidation of a significant amount of long positions.
After observing some sideways movement, the metric has been on its way back up again, suggesting investors have been opening new positions. This speculative activity can naturally lead to more volatility for the asset.
In theory, such volatility can take the asset in either direction, but depending on the composition of the positions present on the derivatives market, one direction may be more probable than the other.
The indicator that sheds light on the structure of the sector is the second metric of interest here: the Funding Rate. This indicator basically keeps track of the amount of periodic fee that traders on the derivatives market are exchanging between each other.
From the chart, it’s visible that the Bitcoin Funding Rate has been negative during this recent Open Interest increase. When the metric has a negative value, it means the short holders are paying a premium to the longs in order to hold onto their positions, so the new positions that have appeared in the sector recently would be short ones.
Related Reading
Because of the short-heavy market, it’s more likely that these investors betting on a bearish outcome get caught up in a mass liquidation event, thus taking Bitcoin is a more bullish direction. It only remains to be seen, though, as to how BTC’s price action would play out in the coming days.
BTC Price
Bitcoin had seen a brief rebound above $61,000 yesterday, but the coin appears to be back down under $60,000 today.
Featured image from Dall-E, Coinalyze.net, chart from TradingView.com


