
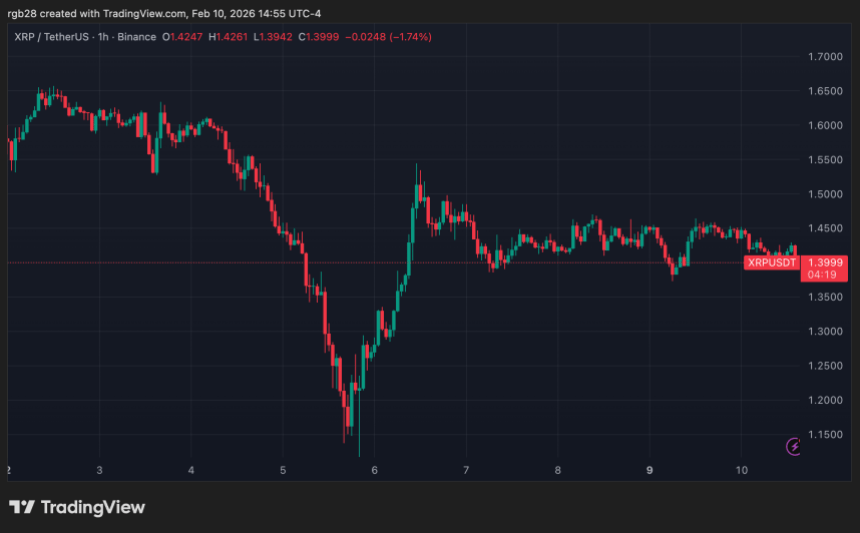
After recovering from last week’s lows, XRP has been moving sideways, hovering between $1.40 and $1.45 during the past four days. As the price attempts to hold its local range lows, a market observer has affirmed that the cryptocurrency could be preparing for a potential recovery if its critical level holds.
Related Reading
XRP At Critical Inflection Point
On Tuesday, crypto analyst ChartNerd highlighted XRP’s performance over the past six months, suggesting that the altcoin could be ‘Positioned for a Major Bullish Structure Shift.”
He explained that the cryptocurrency has seen “6 months of downside with virtually no relief,” while showing key signals, such as the MACD and RSI reaching historical oversold levels.
Moreover, the analyst highlighted the simultaneous retests of the 50-Month Exponential Moving Average (EMA), a prior eight-year resistance line, and the Fibonacci demand zone. “This marks the first 50EMA backtest since November 2024, and doing so, we have a wick marked on the 0.618/0.5 FIB demand zone. A popular reversal pocket,” he noted.
In a video analysis, ChartNerd also emphasized that XRP is currently at a “critical inflection point,” pointing to its 200-week EMA, a level that had not been tested since 2024 until now, and where the price is currently sitting.
The analyst detailed that “this is one of the most important times for XRP because if it holds the line above this moving average, this could set the pace for new all-time highs and continuation of the trend to higher targets.”
For his bullish case, he pointed out XRP’s 2023-2024 performance, when it consolidated above the indicator and held it as support for over a year, leading to the breakout in November 2024.
To him, the important part is to “hold the 200W EMA, defend it, and create a higher low base. This is where XRP could push to new all-time highs if it respects this long-term structure moving average.”
Analyst Warns Of New 50% Correction
The analyst also shared a bearish outlook for XRP, noting that losing the 200W EMA in the weekly timeframe and, more importantly, confirming it as resistance could signal a major drop ahead.
Per ChartNerd’s analysis, if the altcoin starts closing below the 200W EMA, located around the $1.41 area, it risks descending toward the $0.70 mark. This is where the previous local highs that have not been retested since the late 2024 breakout are.
He explained that in 2022, after reaching a local high of around $1.97, XRP “came back down for a retest on its 200-week EMA. It then placed a lower high, lost the 200-week, and corrected even further to its bear market lows.”
Related Reading
In past cycles, when XRP failed to hold this critical inflection level, it entered a deep corrective period, crashing by around 50% toward the bear market bottom.
“So technically speaking, if XRP lost right now, for example, the 200-week EMA and we crashed another sort of 49% roughly, you’re bringing XRP back down to 70, which is again those highs that I spoke about in the past that we haven’t actually back tested for support since breaking out,” he warned.
As of this writing, XRP trades at $1.39, a 3% decline on the daily timeframe.
Featured Image from Unsplash.com, Chart from TradingView.com


