Ripple (XRP) addresses that hold at least 10 million native units have returned to accumulating more in the past three months, a similar scenario that preceded a big rally for the XRP/USD and XRP/BTC pairs in late 2020.
The return of XRP ‘mega whales’
A 76% spike in XRP “mega whale” addresses since December 2021 has been noted by analytics firm Santiment showing that they added a total of 897 million tokens, worth over $712 million as of Feb. 18, to their reserves.
The platform further highlighted that the XRP accumulation witnessed in the last three months was the second-largest in the coin’s existence. The first massive accumulation took place in November–December 2020 that saw whales depositing a total of 1.29 billion XRP to their addresses.
Interestingly. the spike in XRP supply into the whale addresses coincided with a price bounce against Bitcoin. The XRP/BTC exchange rate surged by nearly 150% to as high as 3,502 satoshis between Nov. 1, 2020, and Nov. 24, 2020.
XRP also strengthened against the dollar as with XRP/USD rallied by more than 250% to $0.82 in the same period. As a result, the recent uptick in whales-led accumulation raised possibilities of a similar upside trend in the XRP market, Santiment hinted in the chart above.
Nonetheless, it is vital to mention that XRP’s massive boom in November 2020 came primarily in the wake of Ripple’s move to purchase $46 million worth of XRP to “support healthy markets.”
XRP price holding rebound gains
The recent bout of XRP accumulation among whales partially appeared alongside a recovery over the past weeks.
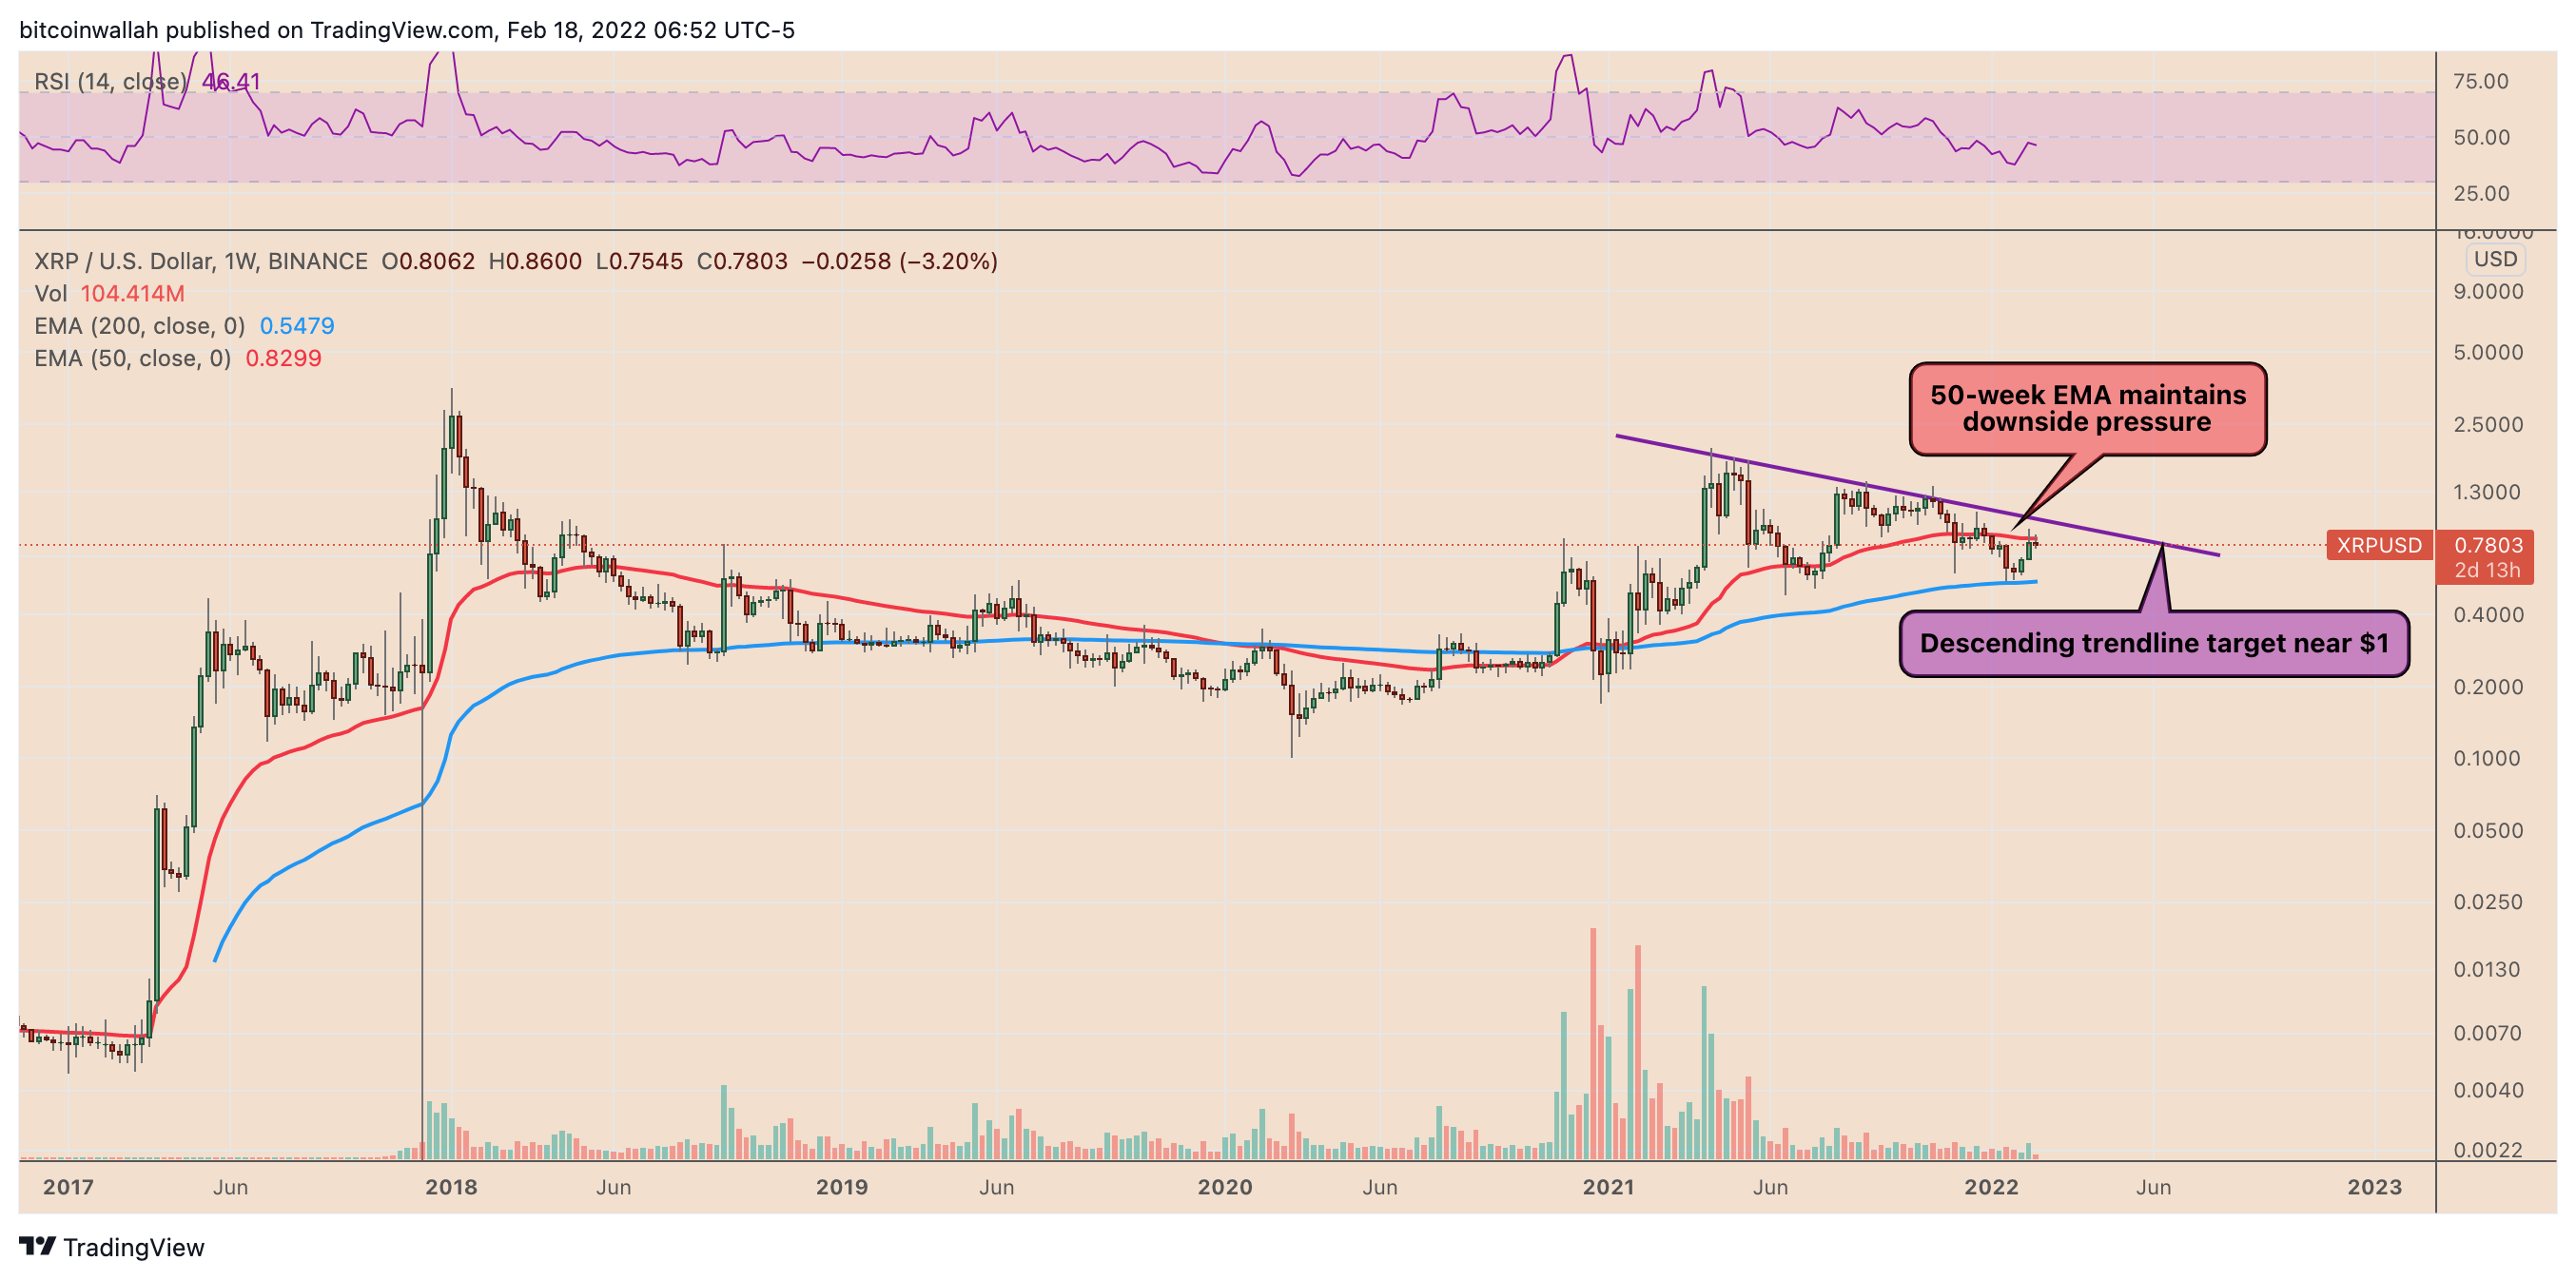
XRP’s price rebounded by as much as 65% to $0.91, less than three weeks after bottoming out at $0.55 on Jan. 22, 2022. Nonetheless, as of Feb. 18, the price had fallen back to near $0.77, suggesting that bulls reeled under the pressure of the 50-week exponential moving average (50-week EMA; the red wave in the chart below).

Cointelegraph discussed a similar pullback setup in its analysis last week, suggesting that a selloff near the 50-week EMA could trigger an extended downside move toward the 200-week EMA (the blue wave) near $0.54.
Conversely, the setup also indicated that a decisive move above 50-day EMA might push the price to its multi-month descending trendline resistance near $1.
Related: XRP gains 30% after Ripple gets permission to explain ‘fair notice defense’ vs. SEC
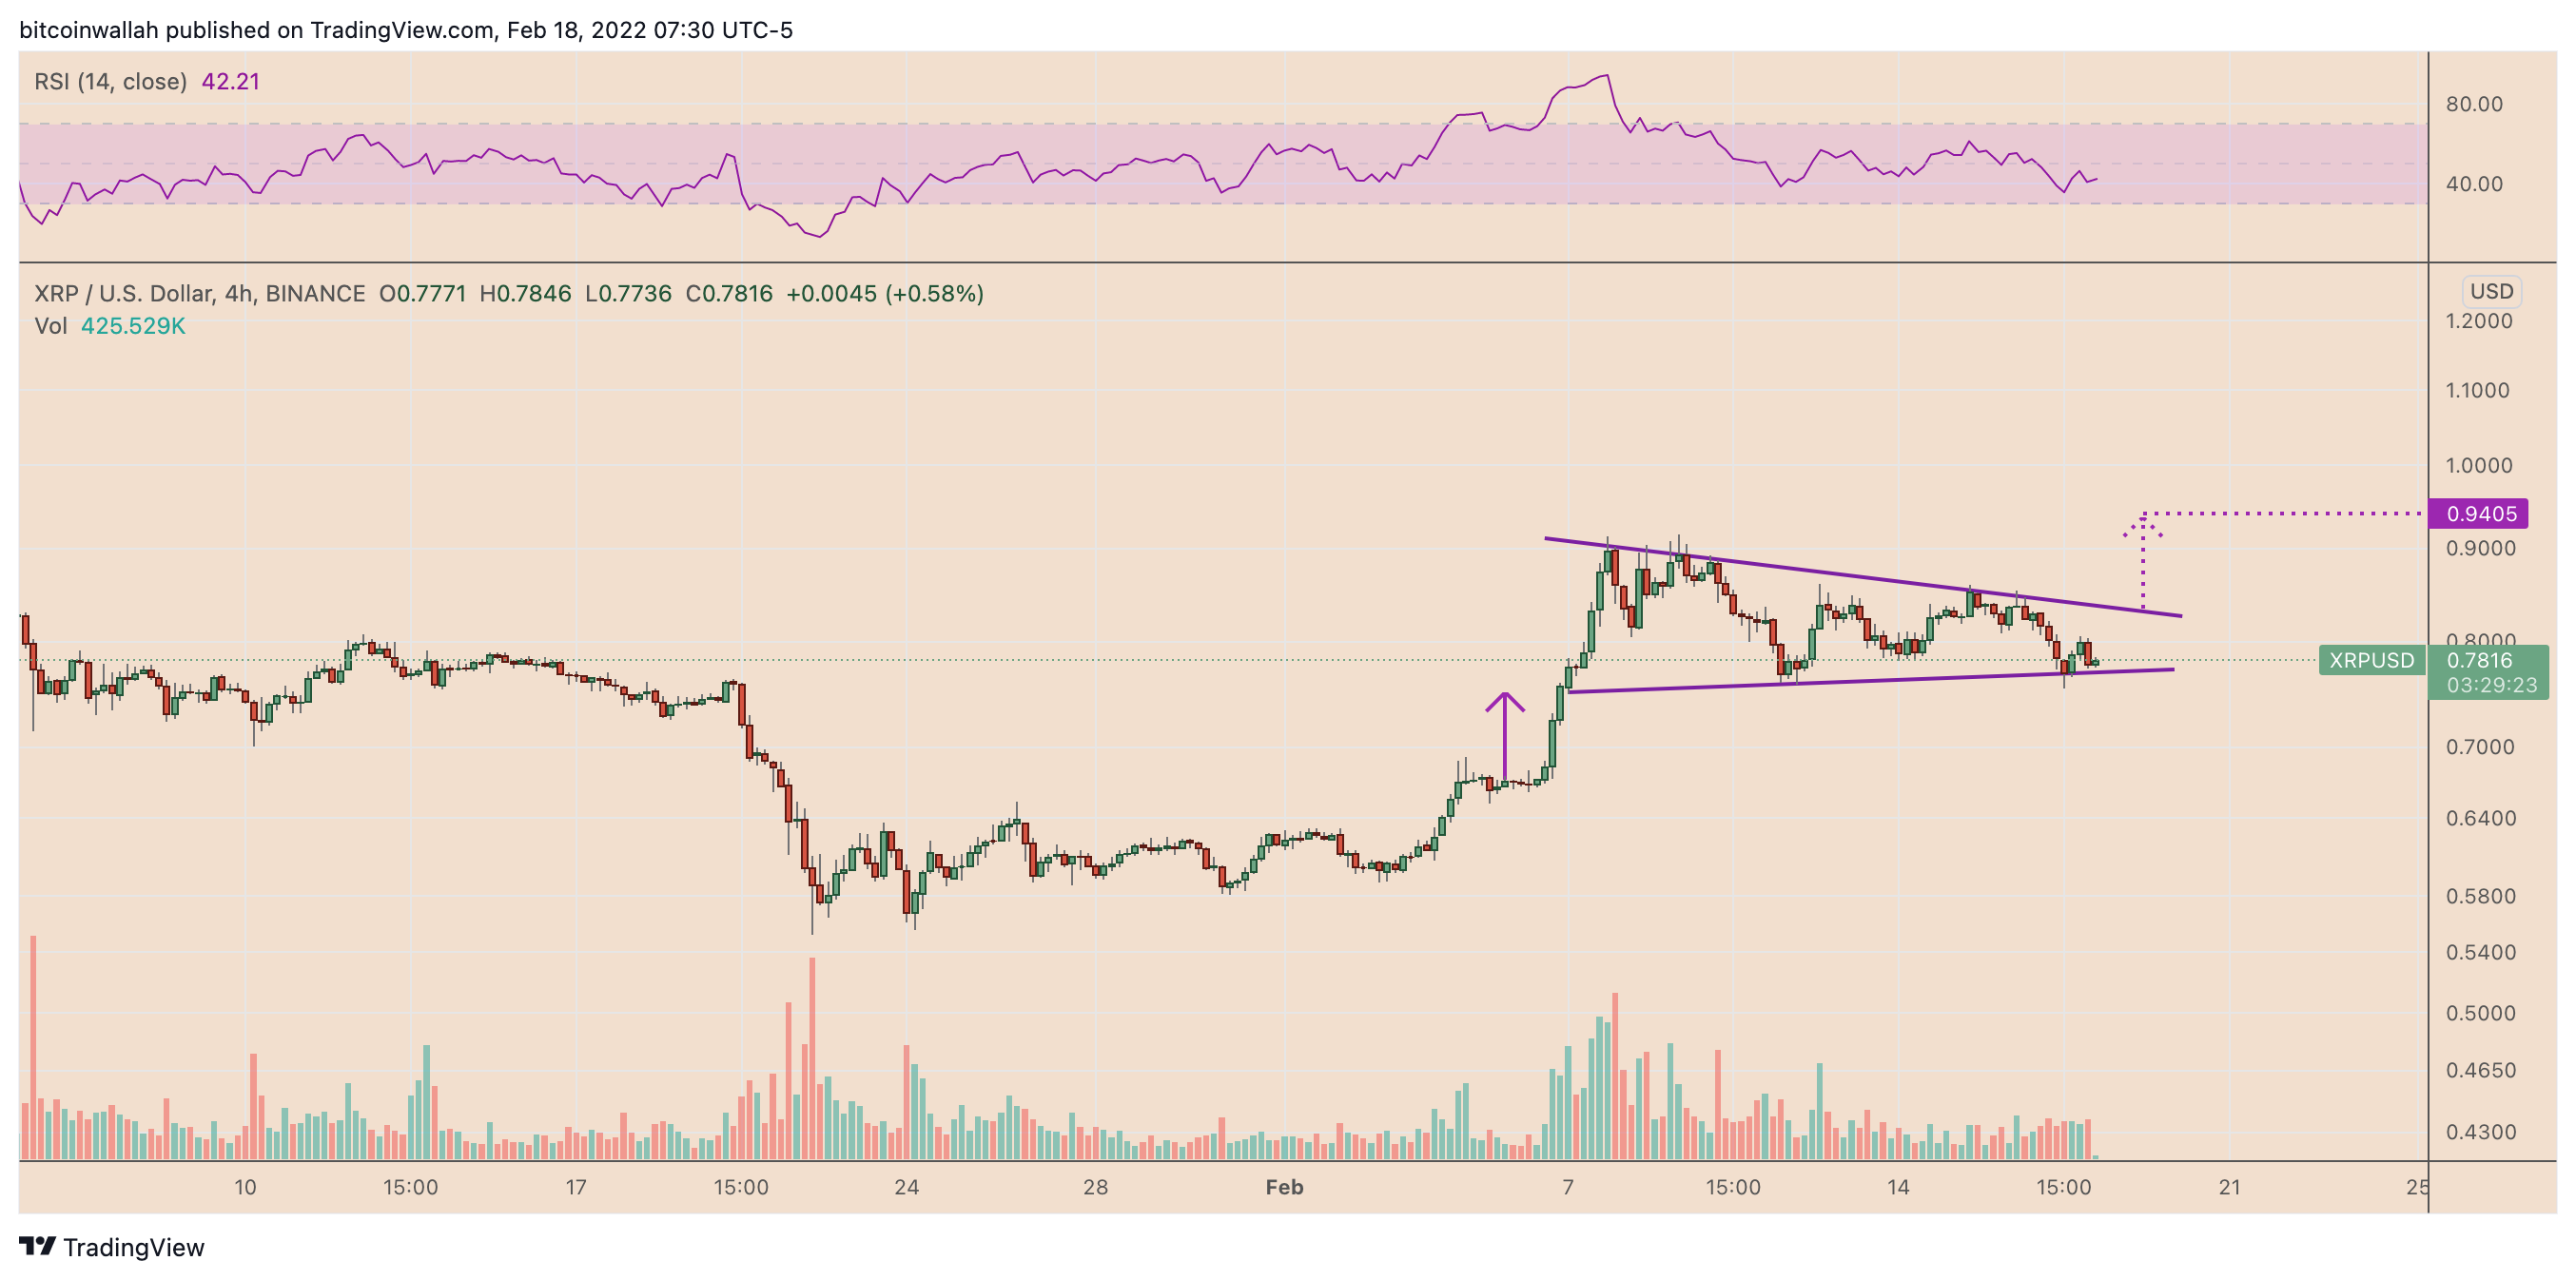
The price action on shorter-timeframe charts also suggests an imminent rally toward $1. For instance, XRP has been forming what appears to be a bull pennant setup on a four-hour chart, confirmed by an ongoing consolidation in a symmetrical triangle.

A basic rule of the bull pennant setup is that it prompts the price to go higher once it decisively breaks above the structure’s upper trendline, and thus eyeing levels above $1.
The views and opinions expressed here are solely those of the author and do not necessarily reflect the views of Cointelegraph.com. Every investment and trading move involves risk, you should conduct your own research when making a decision.


