
XRP News: On-chain analytics firm Glassnode has recorded XRP’s 90-day realized profit-to-loss ratio at 0.38, meaning that for every $1 of profit realized on-chain, investors are booking $2.63 in losses, and has classified the current market phase as one of “intense capitulation.”
The reading sits at less than half the 1.0 equilibrium threshold that separates net-profit from net-loss regimes, and represents a near-total reversal from the ratio’s peak of approximately 50 during XRP’s 2025 euphoria phase, when realized gains dwarfed losses by an almost incomprehensible margin.
Source: Glassnode on X
XRP was trading near $1.10 at the time of the analysis, below its aggregate realized price of approximately $1.48, meaning the average holder is currently underwater on a cost-basis basis.
Glassnode stated directly that “this ratio so far from the equilibrium threshold of 1 shows a market where most investors moving their tokens do so at a loss, a typical characteristic of intense capitulation,” and added that “this dynamic has completely reversed” relative to the prior bull phase.
The speed of the reversal, from 50 to 0.38 across a single cycle, has drawn comparisons to the structural deterioration Glassnode documented for XRP in early 2022, the last time the asset entered a comparably loss-dominated on-chain regime.
EXPLORE: Next Crypto to Explode in Q2
XRP News: Compounding Signals, XRPL Fees, SOPR, and Supply Underwater
The realized profit loss ratio does not stand alone. XRPL fees, measured on a 90-day moving average, collapsed from approximately 5,900 XRP per day in February 2025 to just 500 XRP, a 91.5% reduction that Glassnode attributes to a sharp decline in transactional demand associated with the prior speculative phase.
The fee metric is a direct proxy for block-space demand: when developers, payment processors, and active users transact on the XRP Ledger, fees rise; when they withdraw, fees fall, and a 91.5% decline is not fee optimization, it is user exodus.
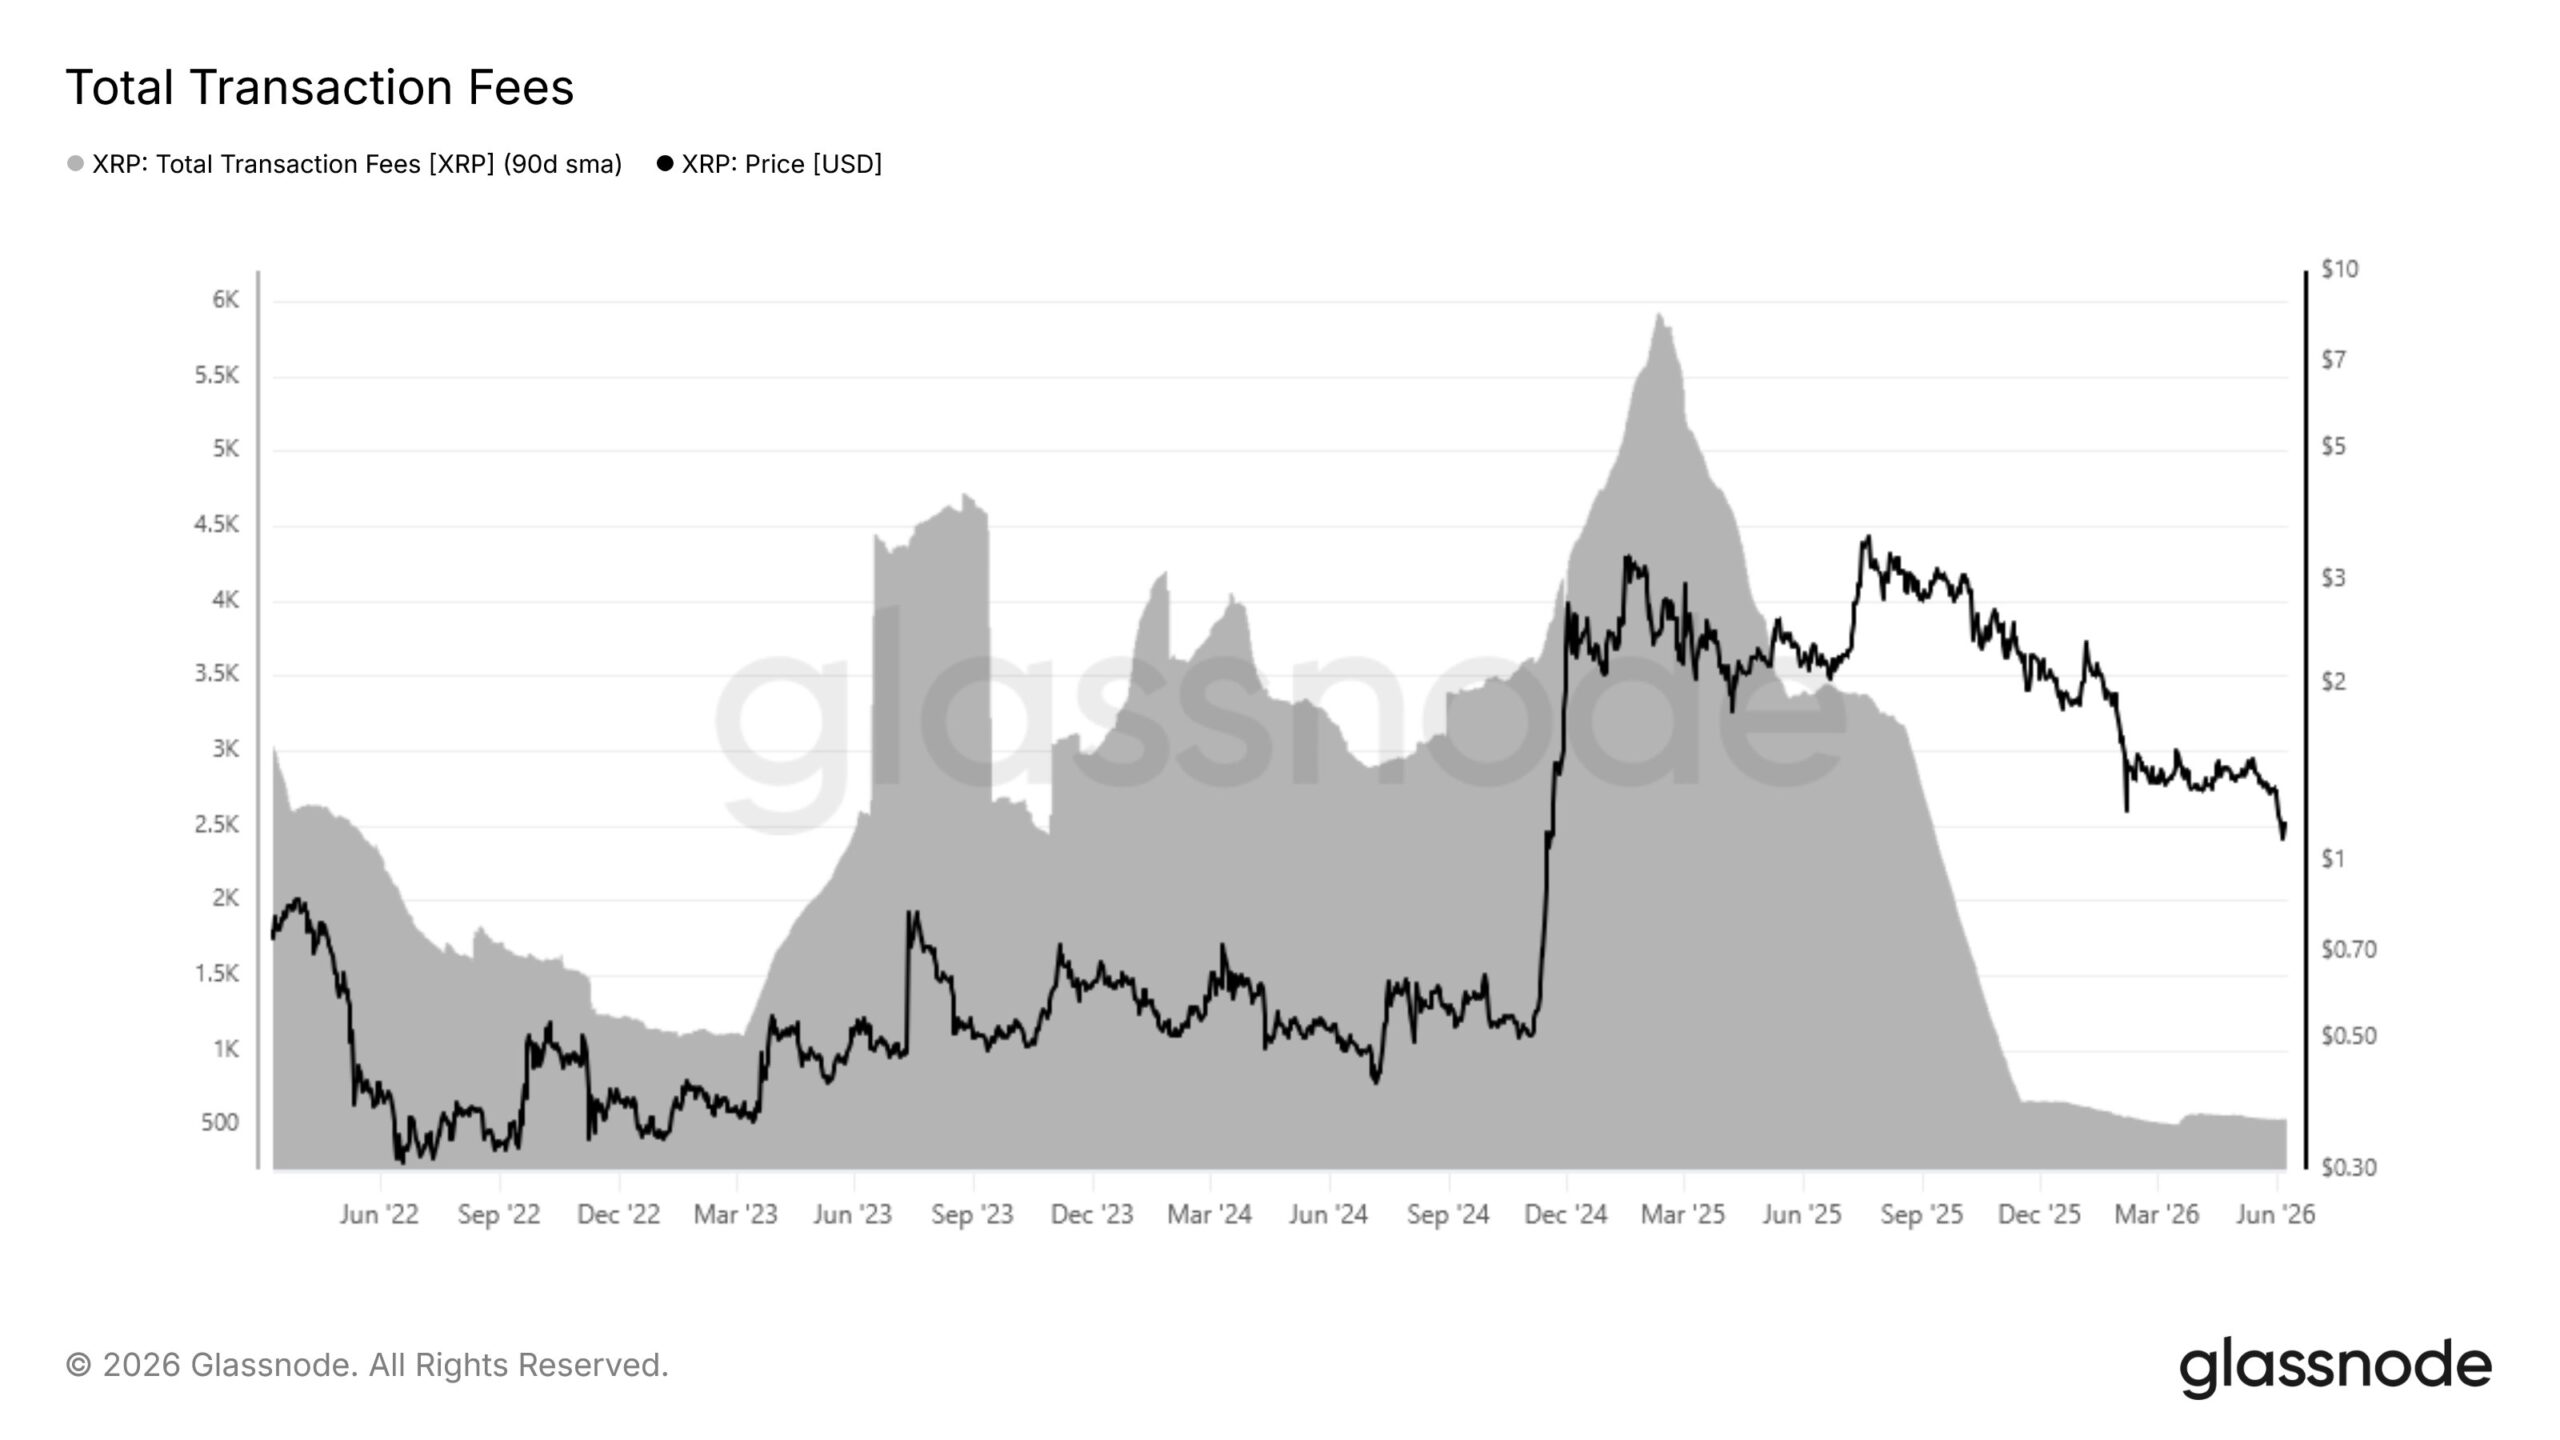
Source: Glassnode on X
Separately, XRP’s Spent Output Profit Ratio, or SOPR, slid from approximately 1.16 in July 2025 to 0.96 by early 2026, crossing below the critical 1.0 breakeven line that separates net-gain from net-loss coin movement.
SOPR below 1.0 means that the average coin being moved on-chain was acquired at a higher price than its current sale price, a structural confirmation that loss realization, not profit-taking, is driving on-chain activity. Compounding this, Glassnode data indicate that approximately 41.5% of circulating XRP supply, roughly 26.5 billion tokens, is currently held at a loss, with 62.8% of XRP’s realized cap concentrated in investors who established their cost basis within the past six months, a distribution profile Glassnode characterizes as “top-heavy” and structurally fragile.
EXPLORE: XRP Institutional Outflows and the Four-Month Low: What the Flow Data Showed
XRP Capitulation: What the On-Chain Metrics Are Actually Showing
The analytical question is no longer whether XRP is in capitulation; the on-chain metrics confirm that it is. The question is whether the current configuration constitutes a terminal flush that precedes a cycle reset, or a structural demand collapse severe enough to make Glassnode’s implicit warning about a distant next rally the operative scenario.
The mechanics of the realized profit-to-loss ratio function as follows: the metric compares the aggregate dollar value of profits realized by coins moving on-chain against the aggregate dollar value of losses realized in the same window, smoothed here across a 90-day average to remove short-term volatility. A reading of 1.0 indicates equilibrium.
A reading of 0.38 indicates that the market is not merely weak – it is structurally dominated by holders who have either been forced to sell or have abandoned any expectation of near-term recovery. In prior Bitcoin cycles, realized profit-to-loss ratios at comparable extremes – around the December 2018 and November 2022 lows, preceded eventual bottoms, though the lag between extreme readings and price recovery ranged from weeks to several months and was not guaranteed by the ratio alone.
The “top-heavy” holder distribution that Glassnode identifies amplifies the downside transmission mechanism in a specific way: when 62.8% of realized cap was established by buyers who entered within the past six months, those buyers hold cost bases near the 2025 peak prices.
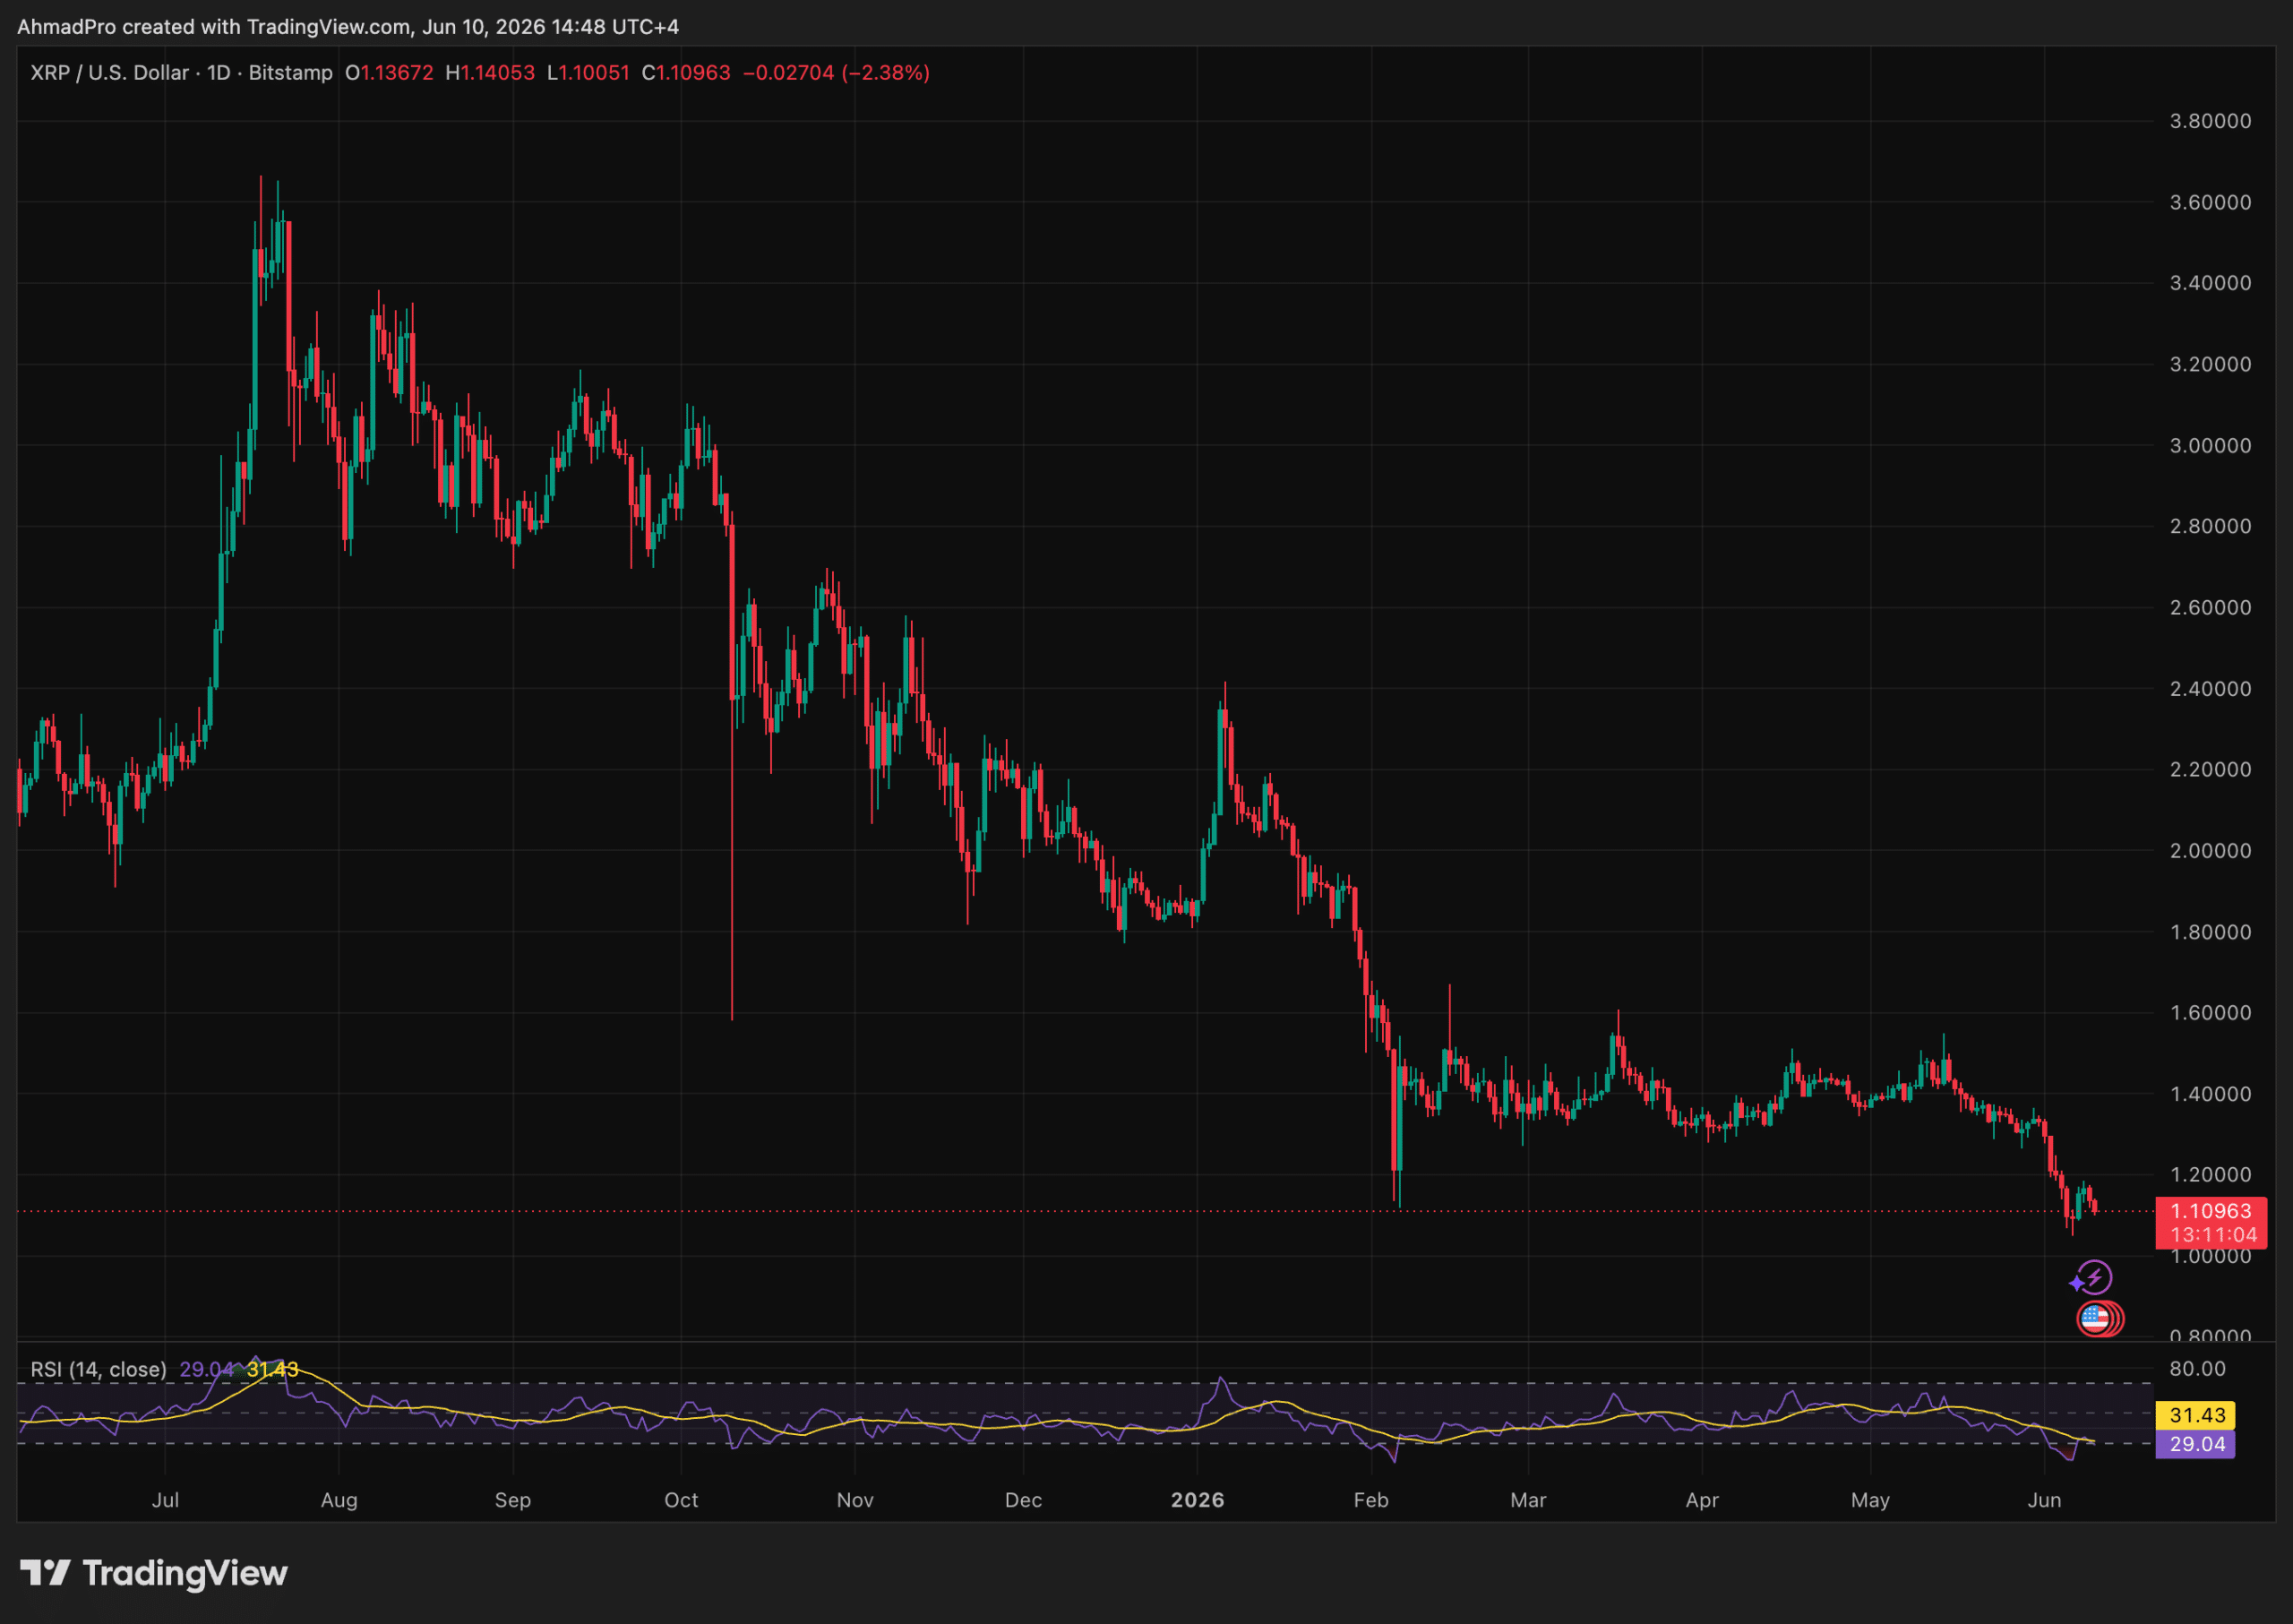
Source: XRPUSD / Tradingview
As XRP price falls below their acquisition levels, they enter the underwater cohort and face a binary choice: hold and wait, or sell and crystallize losses. When organic network demand, measured by XRPL fees, simultaneously collapses, there is no fundamental use-case catalyst to interrupt that selling calculus.
The result is the self-reinforcing loop that characterizes late-cycle capitulation: more sellers, fewer buyers, declining fees, declining prices. It is necessary to flag the epistemic status of this data: what the realized profit loss ratio at 0.38 proves is that capitulation is occurring with intensity. What it does not prove is that capitulation is complete, or that current price levels represent a durable floor.
DISCOVER: Best Meme Coins to Buy in 2026
Disclaimer: Coinspeaker is committed to providing unbiased and transparent reporting. This article aims to deliver accurate and timely information but should not be taken as financial or investment advice. Since market conditions can change rapidly, we encourage you to verify information on your own and consult with a professional before making any decisions based on this content.

Daniel Frances is a technical writer and Web3 educator specializing in macroeconomics and DeFi mechanics. A crypto native since 2017, Daniel leverages his background in on-chain analytics to author evidence-based reports and deep-dive guides. He holds certifications from The Blockchain Council, and is dedicated to providing “information gain” that cuts through market hype to find real-world blockchain utility.

