The XRP price has appreciated over the last 24 hours as market movers also witnessed the same price movement.
The coin gained 1.6% in that time frame. It is, however, still safe to say that the asset is consolidating.
In the past week, the XRP price has barely shown any movement, confirming sideways trading. The technical outlook for XRP shows that buyers are losing control of the market as selling strength continues to mount at press time.
XRP has to move past its immediate resistance line, and then only then will buyers regain strength. The coin has also formed a symmetrical triangle pattern over the last week.
This pattern is connected with either a breakout or a breakdown in price, as it also confirms that the coin has been trading laterally.
On the developmental front, Ripple began testing its XRP Ledger Sidechain, which is compatible with Ethereum Smart Contracts. This new development is yet to have an effect on the asset’s price.
XRP Price Analysis: One-Day Chart
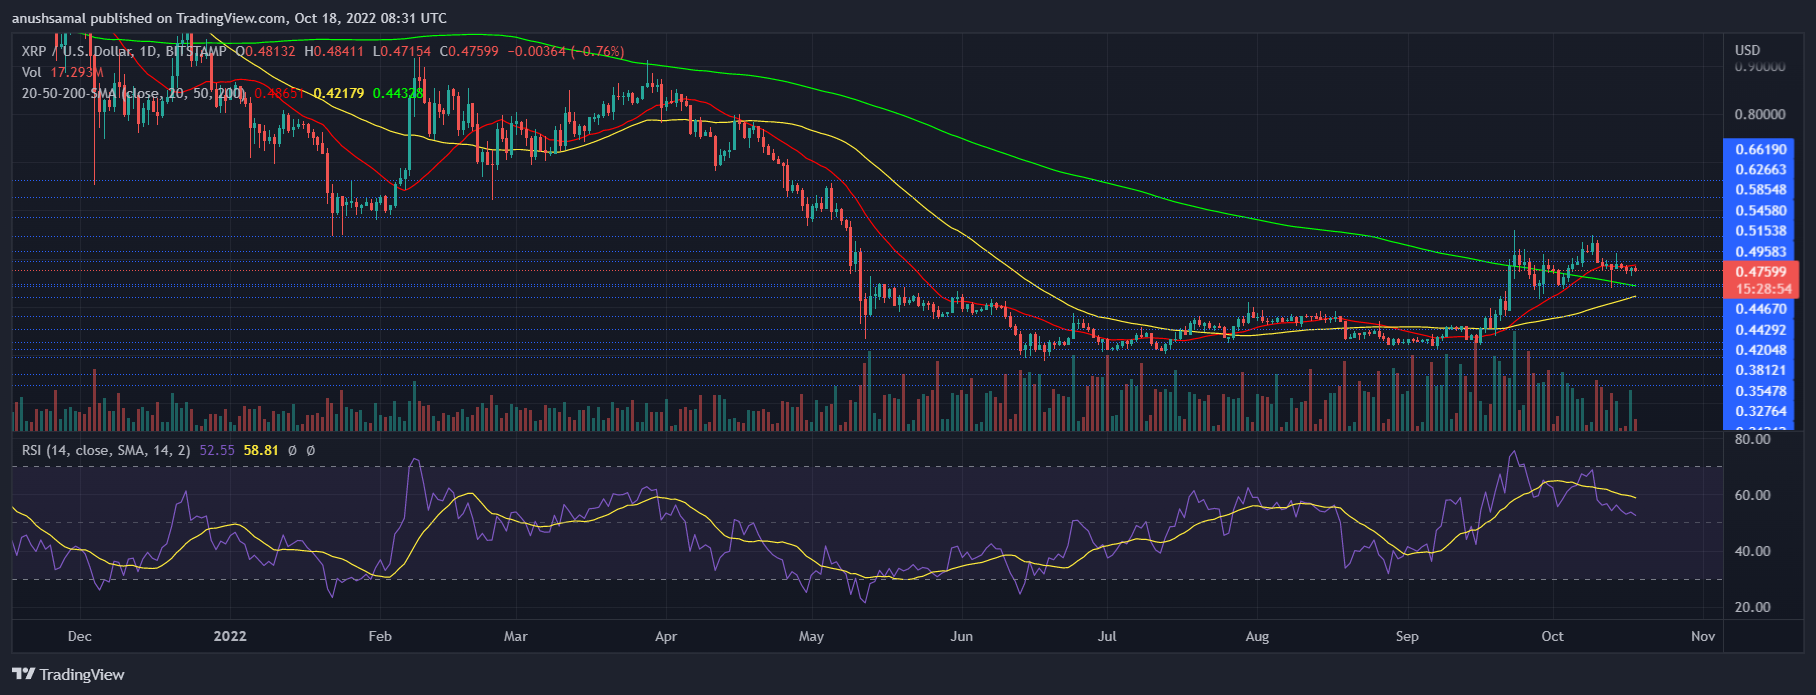
The altcoin was trading at $0.47 at the time of writing. As seen on the one-day chart, XRP price also formed a symmetrical triangle pattern, which hints at either a breakout or a breakdown in price.
Buyers have struggled to lift the price of XRP but met with sellers each time the coin visited the immediate resistance level.
The overhead price ceiling was set at $0.51. A move above $0.51 will cause the XRP price to experience a breakout, which would then increase the buying strength.
The local support level of the coin stood at $0.44 and a fall from that level could bring XRP to $0.40. The amount of XRP traded in the last session declined, pointing to a fall in buying pressure.
Technical Analysis

The rise in price did not prove to be beneficial for the buyers as the coin registered a fall in the buying pressure. Indicators pointed out that sellers could take over the market in the next trading session.
The Relative Strength Index was still above the half-line but the indicator was inching closer to the half-line.
This signifies that the sellers would outnumber buyers soon.
The XRP price was also below the 20-SMA line, and that signalled a fall in demand, the reading meant that sellers were driving the price momentum in the market.

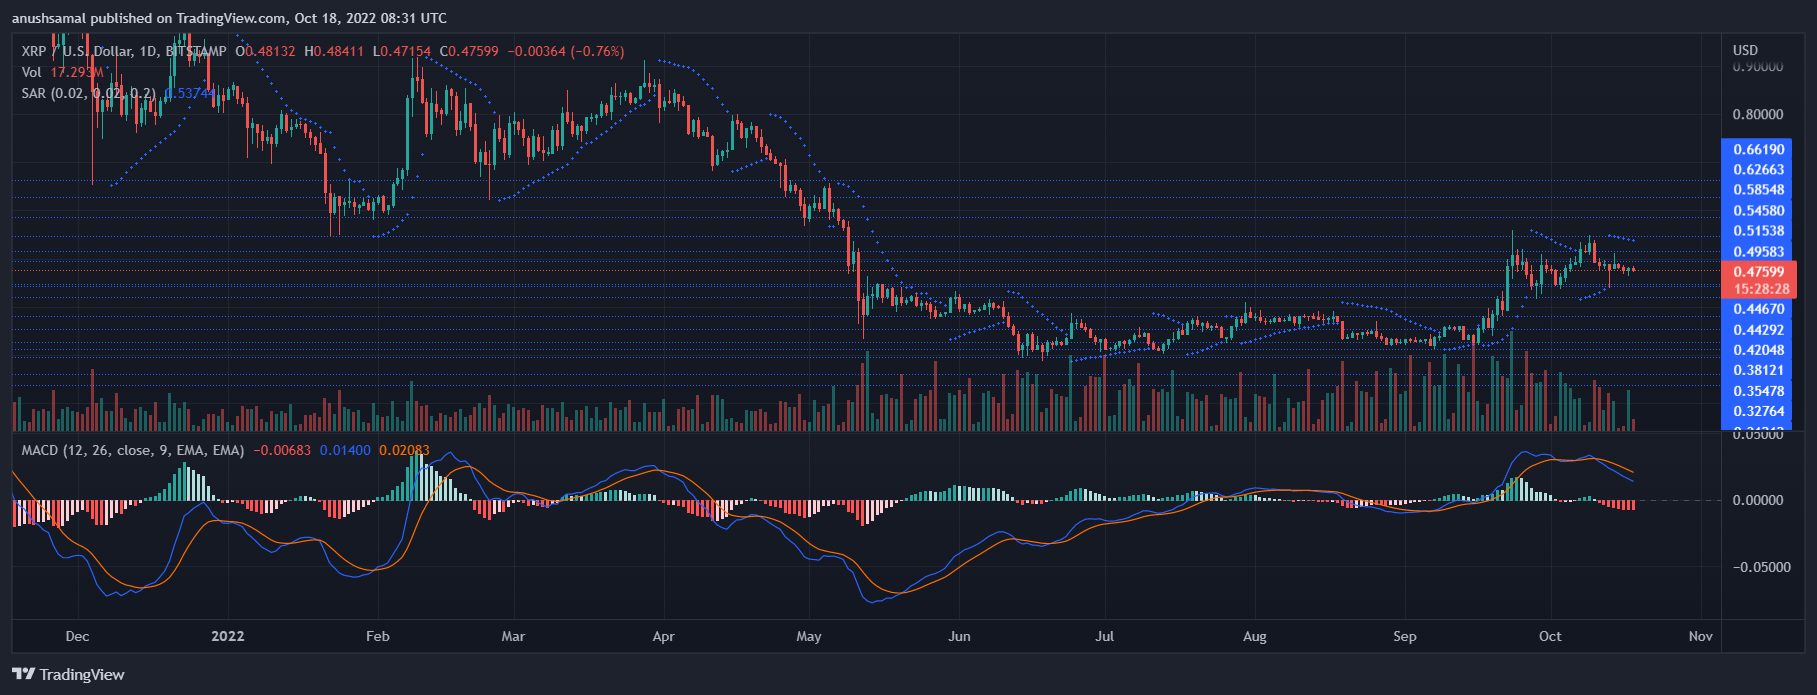
In accordance with the other technical indicators, XRP also noted sell signal on its chart. The Moving Average Convergence Divergence indicates the price momentum and strength of the asset.
The MACD showed a bearish crossover with red histograms, which were sell signal for the coin.
The Parabolic SAR displays the price direction of the asset, determining if it is bearish or bullish. The dotted lines above the candlestick indicate that XRP price will witness a fall over the upcoming sessions.


