
Bitcoin (BTC) teased more volatility at the Dec. 30 Wall Street open with BTC/USD heading ever closer to $16,000.
Will new year deliver “long-awaited volatility?”
Data from Cointelegraph Markets Pro and TradingView showed BTC/USD wicking down to lows of $16,337 on Bitstamp.
The pair had been gradually upping the volatility in the days after Christmas, as analysts eyed the likelihood of a final burst of action before the yearly close.
“Last trading day of the year for TradFi, but crypto will trade through the holiday weekend. Perhaps we may see some of that long awaited BTC volatility around the Weekly/Monthly close and the start of 2023,” on-chain analysis resource Material Indicators ventured.
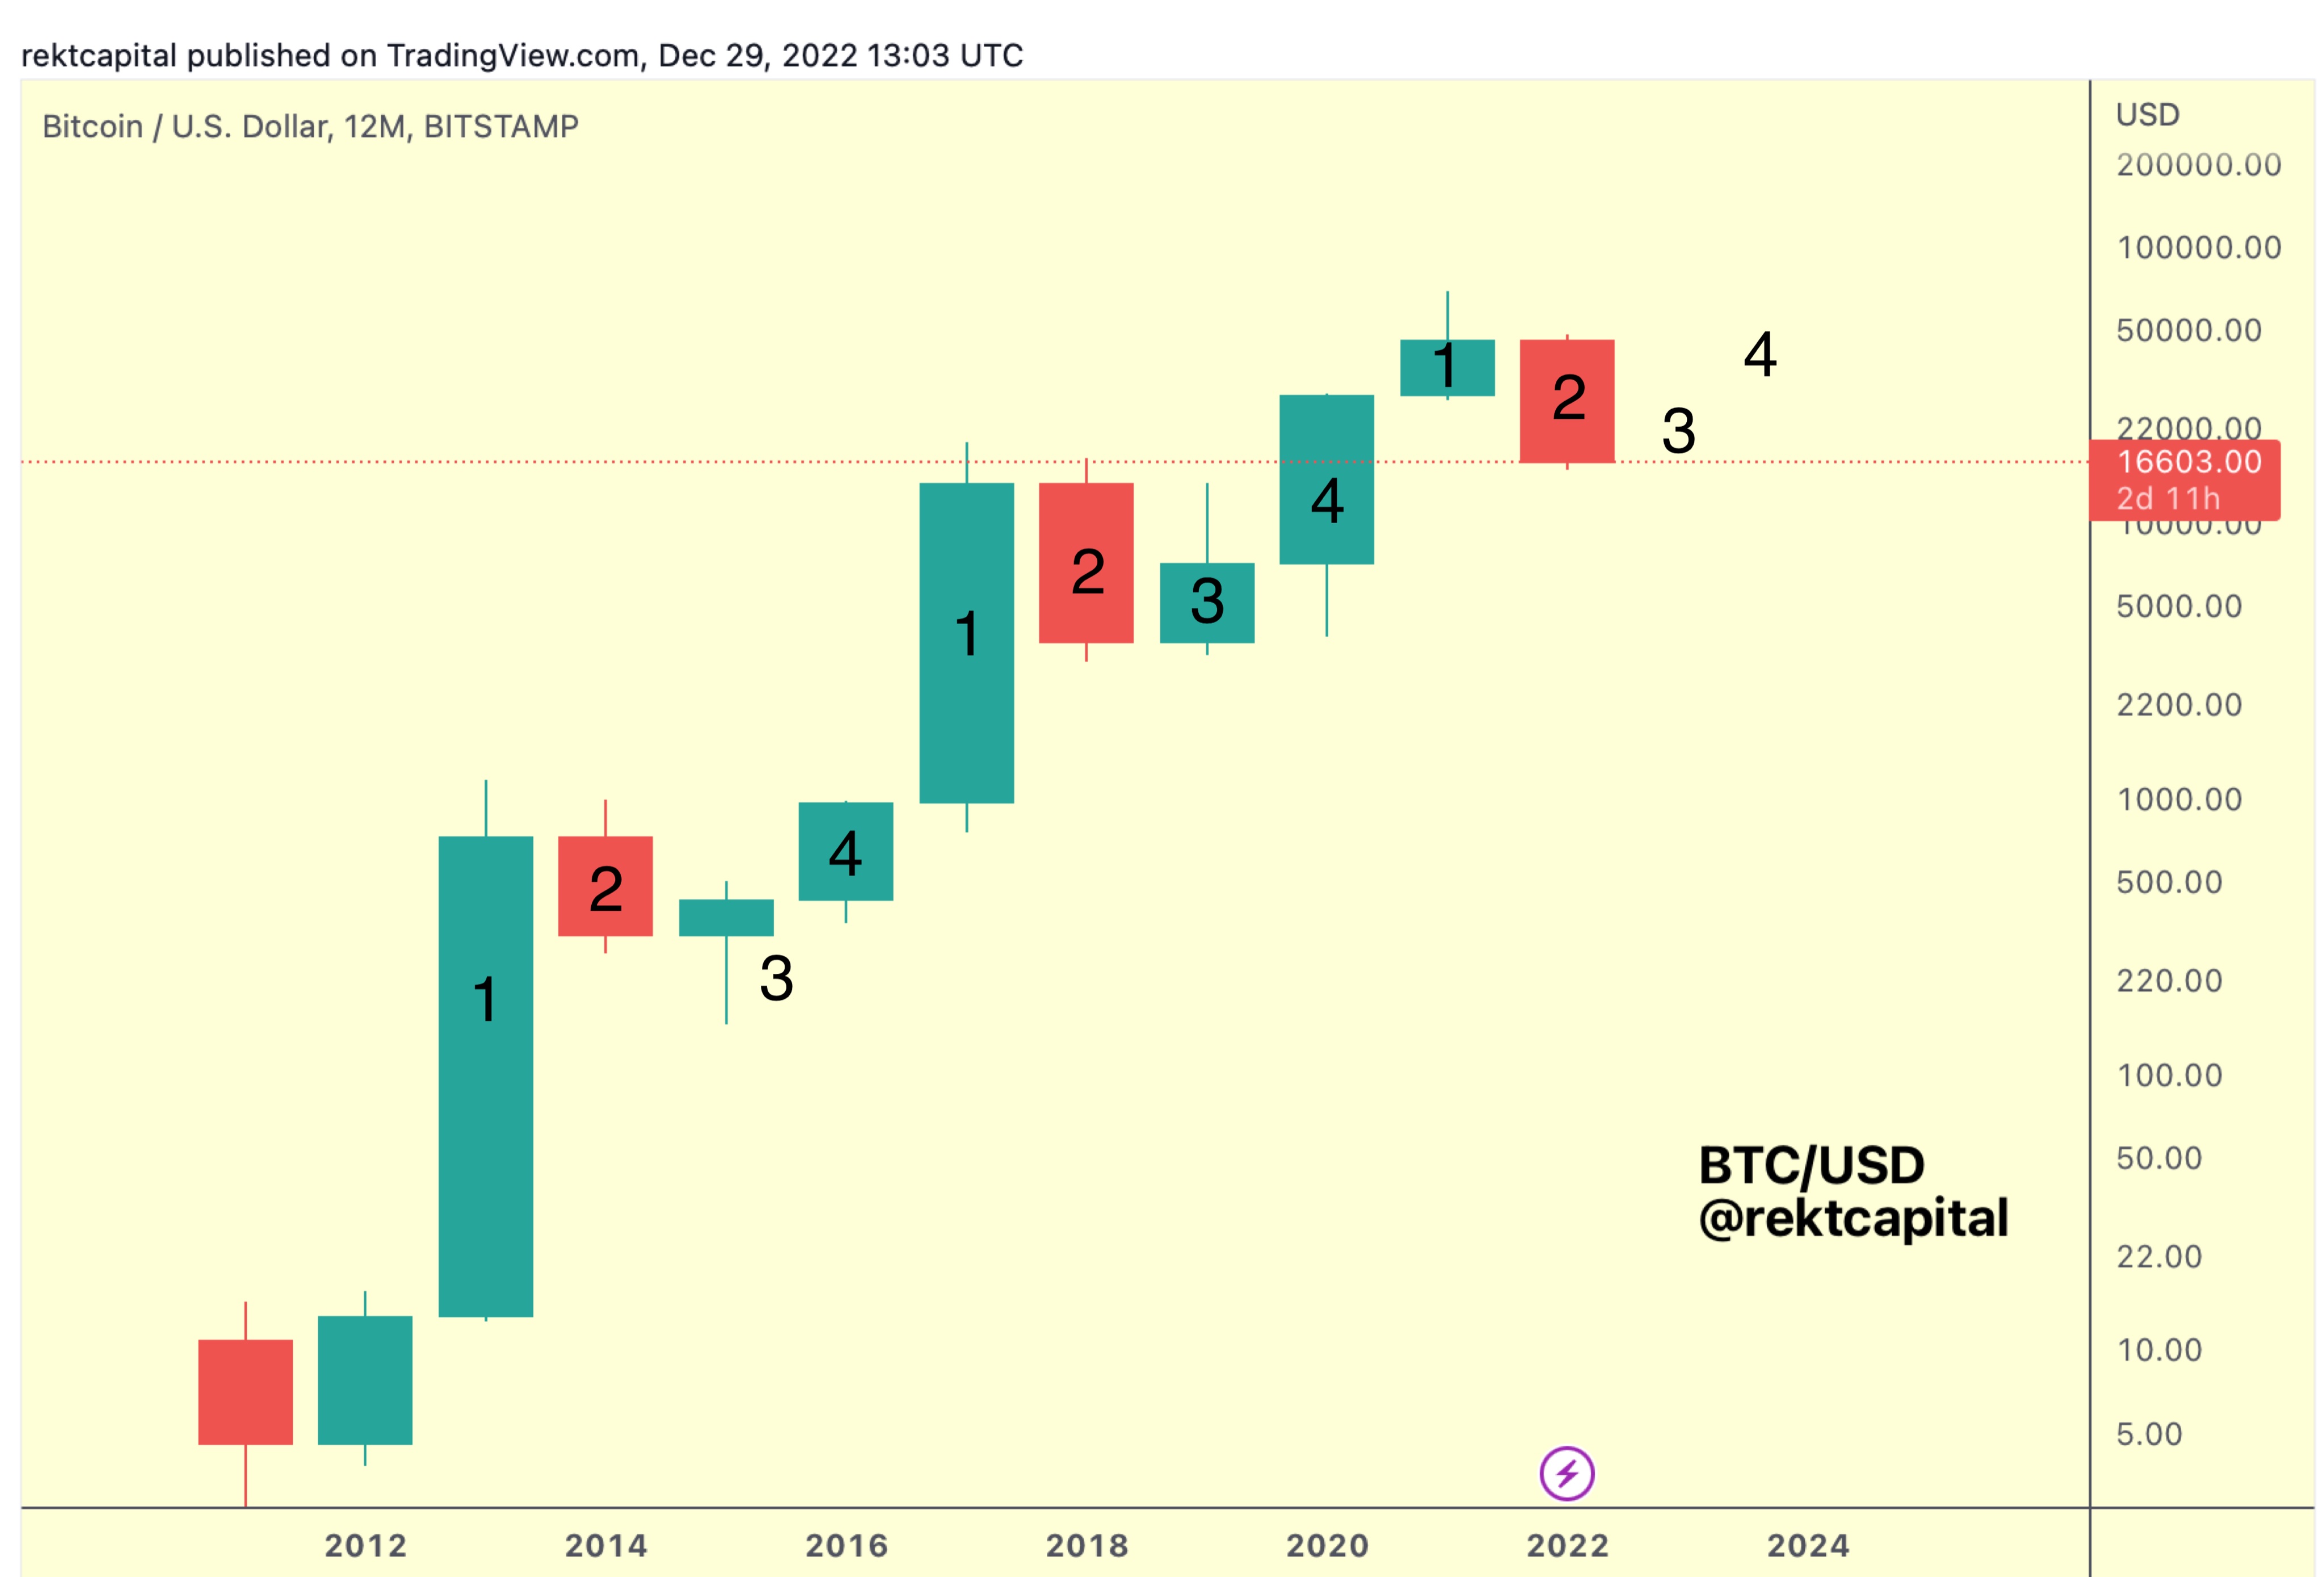
Popular trader and analyst Rekt Capital noted that “historically, a strong indicator of where the $BTC bottom is is when the bearish BTC Candle 2 performs its Yearly Close.”
Rekt Capital was discussing Bitcoin’s four-year halving cycles, with the year after the halving traditionally one of overall losses.
The worst could be in by the end of the week, he thus argued, “and whatever downside wicking occurs in the following Candle 3 is just a bonus for bargain buyers.”
On lower timeframes, the picture remained unclear, with BTC/USD stuck in a narrow range still $1,000 above its multi-year lows from Q4.
Order book data from Binance uploaded by Material Indicators showed a lack of tangible support between spot price and $16,000, with resistance stacked at $17,000 and higher.

As Cointelegraph reported, predictions for Q1, 2023 range from a recovery above $20,000 to a fresh shock for bulls in the form of a trip below $10,000.
Risk assets could see “some reprieve”
On macro, United States equities opened to modest losses, the S&P 500 and Nasdaq Composite Index both down nearly 1% at the time of writing.
Related: Bitcoin ‘not undervalued yet’ says research as BTC price drifts nearer $16K
The U.S. dollar also looked unable to book fresh gains in time for the end of the year, with the U.S. dollar index (DXY) continuing a downtrend to circling six-month lows.
“Keep an eye on the U.S. Dollar Index DXY here! A breakdown could increase momentum for bullish market dynamics,” a hopeful Caleb Franzen, founder of Cubic Analytics, told Twitter followers on Dec. 29.
“The Fed is still tightening, with balance sheet reductions likely to become a significant factor in 2023. Still, risk assets might have some reprieve soon.”

The views, thoughts and opinions expressed here are the authors’ alone and do not necessarily reflect or represent the views and opinions of Cointelegraph.


