Bitcoin (BTC) price lit up today, rallying 5.78% to a daily high of $9,398 before pulling back to consolidate in the $9,300 range. The strong upside move pushed the top ranked digital asset on CoinMarketCap through the $8,800-$8,930 resistance zone.
Since the halving day correction dropped the price to $8,122, Bitcoin price has recovered 14.48%, leading traders to now look for $9,200 to serve as support.
Crypto market weekly price chart. Source: Coin360
As Bitcoin slowly works its way back toward $10,000, the $9,300 to $9,400 zone could be a sticking point where resistance will provoke a retest of former levels of resistance at $9,200 and $9,061 where the 78.6% Fibonacci Retracement is located.
BTC USDT 1-hour chart. Source: TradingView
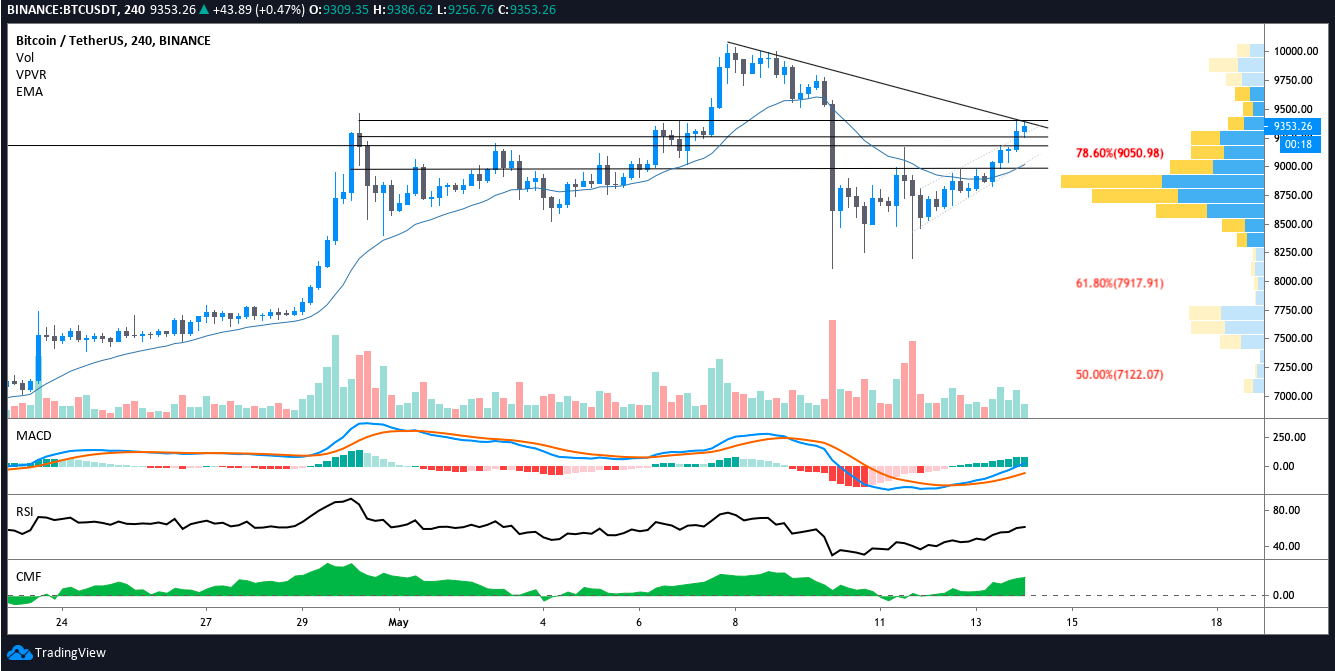
In the hourly time frame Bitcoin price appears to be forming a bull flag as the flagpole was established on a high volume surge and the current consolidation is accompanied by decreasing trading volume.
Over the coming hours the price looks like it will continue consolidating in the $9,260-$9,334 zone where there is a VPVR high volume node which is also aligned with the base of the flag. The descending trendline from the May 7 high at $10,070 remains overhead and twice during today’s session the price met resistance at the trendline.
Today’s rally also brought the price above the ascending channel and throughout the day the price has found support along the top of the channel. A drop below $9,300 places the price back in the channel and increases the likelihood of the price dropping to the 20-MA at $9,180.
If bulls are able to push the price above the $9,400 level traders will target $9,750 as the next destination.
Investor confidence continues to improve
As reported this week by Cointelegraph, Bitcoin’s rapid 14.48% recovery from $8,122 was accompanied by a sharp drop in the digital asset’s implied volatility.
According to Cointelegraph contributor Marcel Pechman the drop in implied volatility simply illustrates a scenario in which ”traders anticipated that the price would either rally or dump during and after the event, thus the short term spike.”
Pechman further explained that:
Implied volatility reaching peak levels means options markets premiums spiked. This should be interpreted as the market charging higher for insurance, and it goes both ways for calls (bullish) and puts (bearish) options.
BTC USDT 1-hour chart. Source: TradingView
Now that the halving has passed the whipsaw volatility witnessed on March 11 could decline but this doesn’t mean a sharp drop to recent lows is off the table.
If the price pulls below $9,000 the next support is at the $8,900-$8,700 zone, and if this level fails to hold the price is close to dropping below the ascending trendline to revisit the $8,300 to $8,100 lows seen on March 9-11.
For the short term, traders should watch trading volume as an increase in sell volume is likely to be followed by a revisit to the $9,200-$9,150 area.
On the other hand, increasing purchasing volume could signal that an impending surge will help the price break out of the pennant and above the resistance at $9,400.
The views and opinions expressed here are solely those of the author and do not necessarily reflect the views of Cointelegraph. Every investment and trading move involves risk. You should conduct your own research when making a decision.


