By CCN: The bitcoin price on Thursday broke above $6,000, a psychological level, to establish a fresh 2019 high.
The bitcoin-to-dollar exchange rate settled an intraday peak towards $6098.21, bringing its best year-to-date performance to 64-percent. The asset’s upside sentiment against the dollar, as well as other leading cryptocurrencies, further pushed its dominance upward to 57-percent, its highest since December 4, 2017. Meanwhile, it’s market capitalization jumped above $107 billion but was still down its historical high of $327.15 billion recorded on December 17, 2017.
BITCOIN PRICE IS HOLDING SUPPORT AT $6,000 FOR THE FIRST TIME SINCE NOVEMBER 15, 2018 | SOURCE: COINMARKETCAP.COM
The bitcoin price is overbought according to technical standards. It means the asset could soon undergo a bearish correction, bringing the rate down below $6,000. But bitcoin will retest $6,000 and extend its uptrend, at least according to three bullish indicators – a mix of both technicals and fundamentals – as discussed below.
#1 Bull Parabola Meets Golden Cross
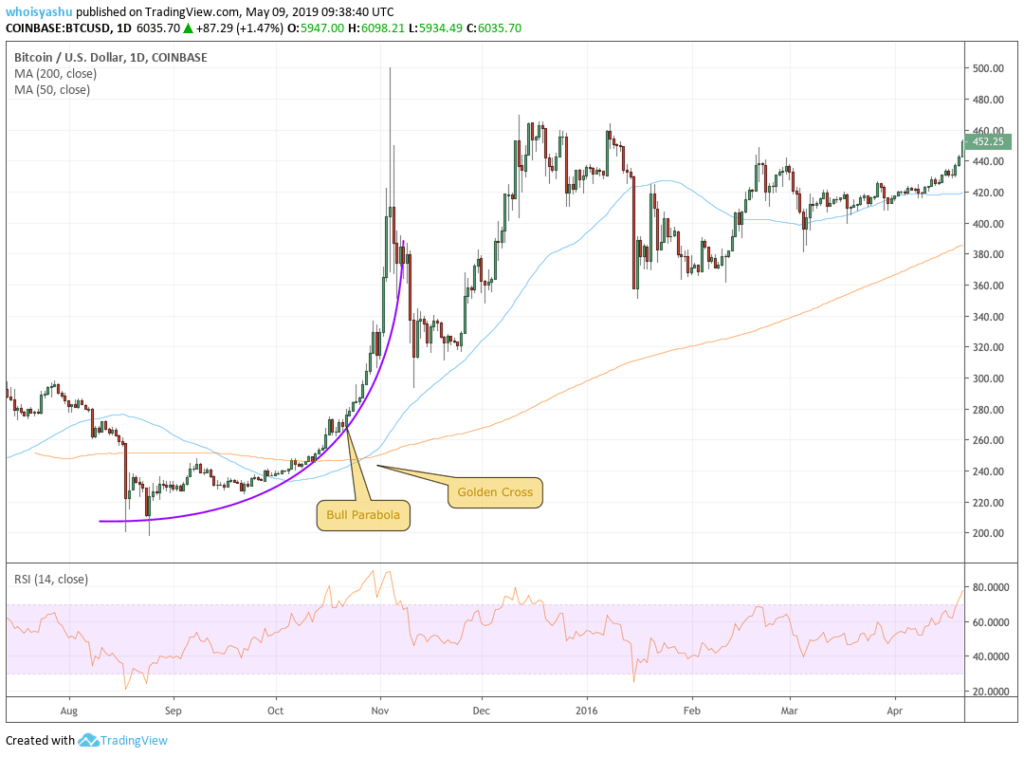
The bitcoin price action as of late is mirroring its own moves recorded between August 2015 and December 2015. Back then, the price had formed a bull parabola, a curvy shape providing support to the then-ongoing uptrend. As bitcoin continued to trend north, its 50-period moving average meanwhile closed above its 200-period moving average. Eventually, the price posted close to 150-percent gains within four months.

OLD CHART – BITCOIN DOWNSIDE ATTEMPTS CAPPING BY A BULL PARABOLA FOLLOWED BY A GOLDEN CROSS FORMATION | SOURCE: TRADINGVIEW.COM, COINBASE
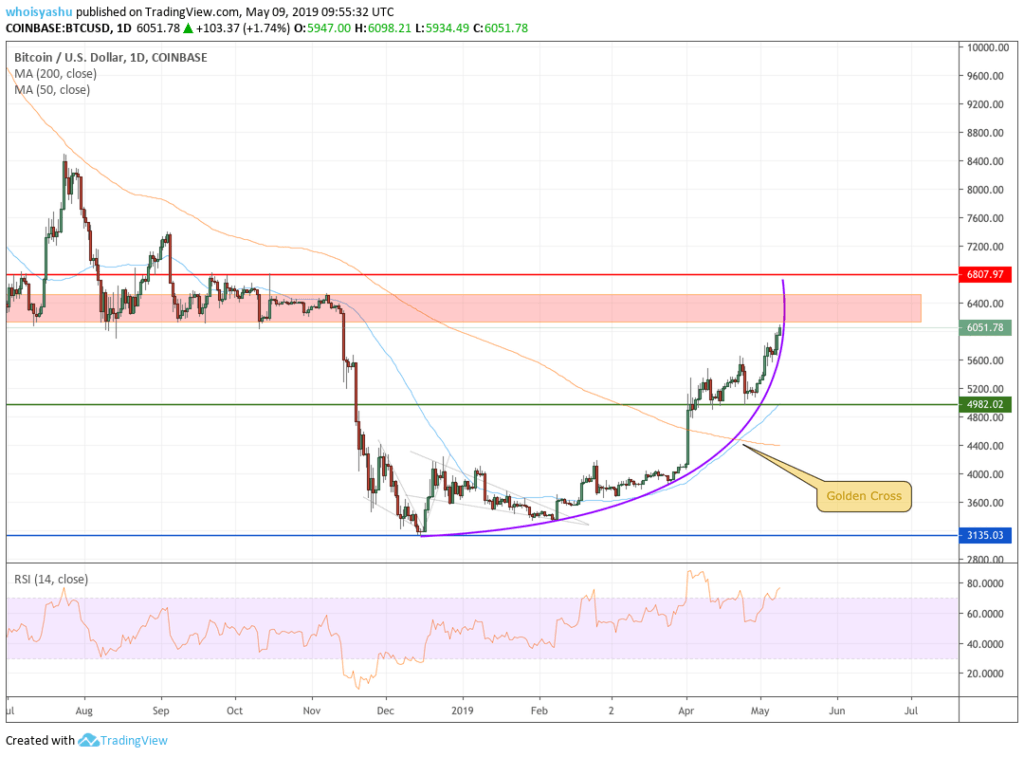
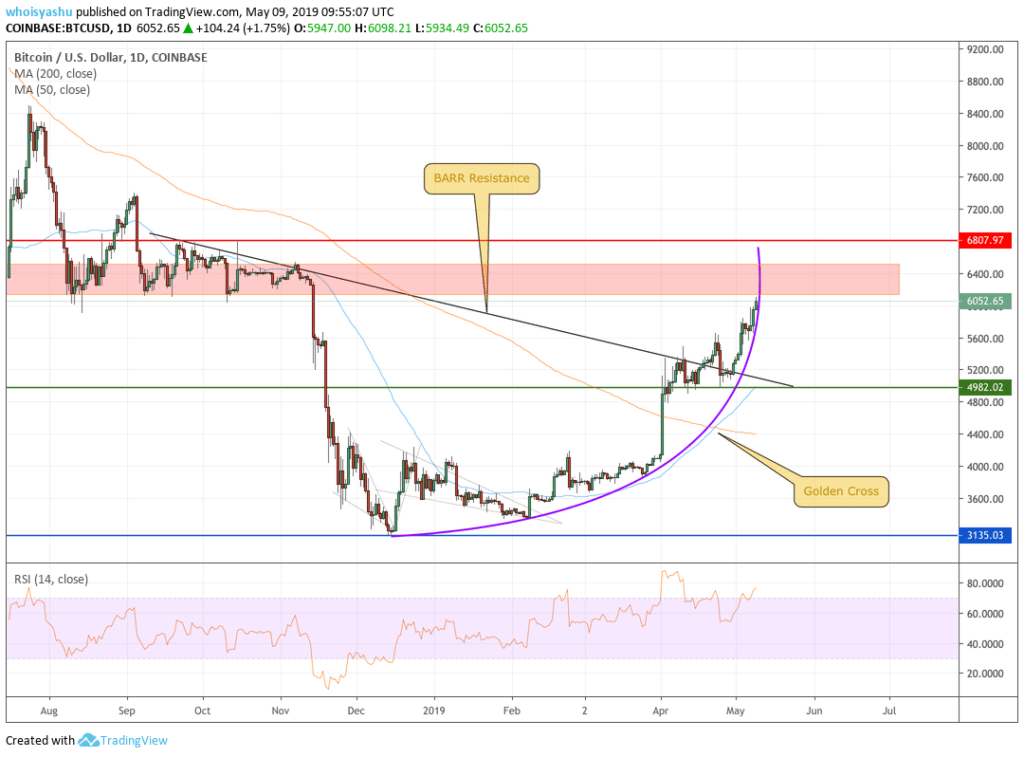
The new chart tells somewhat the same story. Bitcoin went through the textbook devaluation phase (the beginning) but rose later amidst global investment demand (the uptrend; still going on), and will eventually enter a popular speculative mania. In the middle of everything, meanwhile, is a bullish Golden Cross.
Considering the new parabola would mirror sentiments as showed in the old parabola, the bitcoin price is due to rise 57-percent higher than where it is now. That puts the asset’s bull target way beyond $7,000.
#2 Lets Hit the Bitcoin BARR

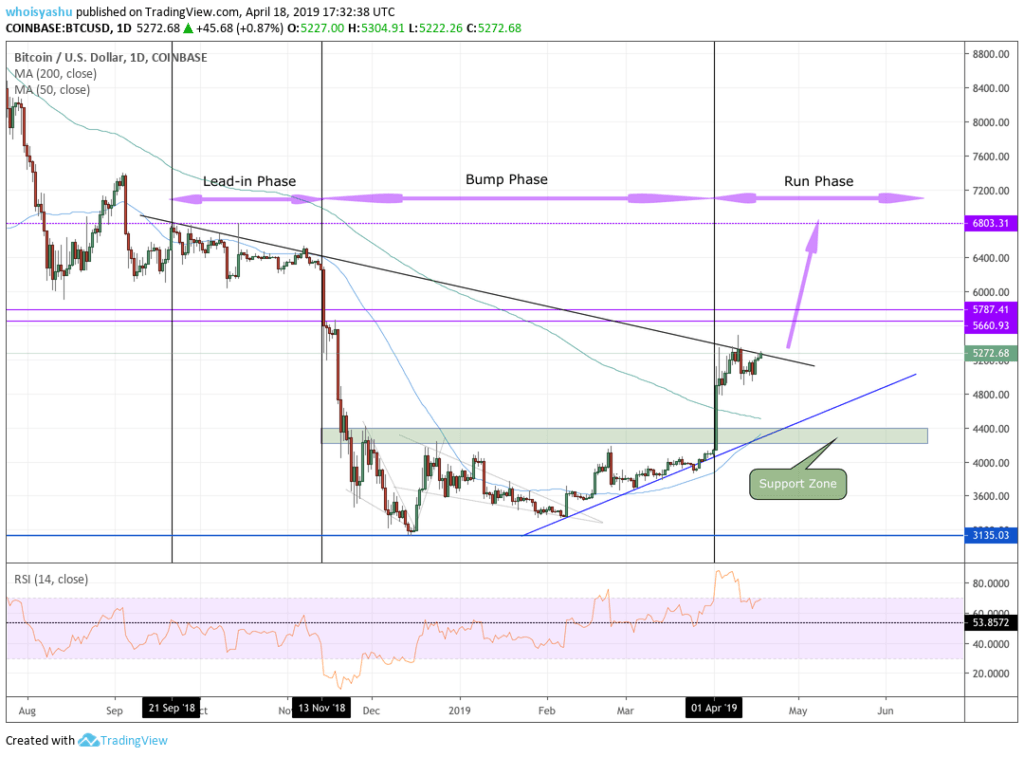
BITCOIN BARR EXAMPLE | SOURCE: TRADINGVIEW.COM, COINBASE
As CCN covered earlier, the bitcoin price had a vast potential to test $6,800 as its primary upside target, according to a textbook trading indicator dubbed as Bump-and-Run Reversal (BARR). In retrospective, the asset had to break above the BARR resistance trendline to initiate a so-called Run phase as shown in the chart above. And it did.
BARR theorizes that the height of a breakout should be close to the height of the drop followed by the Lead-In Phase. That puts bitcoin’s bull target somewhere near $6,800, an ideal level because of its historical significance as resistance.
#3 The High Fidelity Factor
The bitcoin price is more likely to continue a bull run above $6,000 because of strong fundamentals. Fidelity, a Boston-based investment firm, will reportedly add bitcoin trading to its list of services “within a few weeks.” Coupled with Fidelity’s already-live bitcoin custodian services, the move would eventually allow institutional investors, such as family offices, pensions, and hedge funds, to purchase the cryptocurrency while ensuring bank-grade security.
Read CCN’s Fidelity coverage here. Click here for a real-time bitcoin price chart.


