Bitcoin (BTC) hodlers deserve a pat on the back for making it through this last week, as BTC witnessed its largest sell-off in history, in terms of USD value, causing the leading digital asset to shed $70bn of its market cap in a single 24-hour period.
I shudder to think about the fortunes that were lost, but as we are left reeling in the aftermath of this selloff, a question remains. Could anyone have seen this coming? And has the outlook for Bitcoin now changed?
These are two questions I will attempt to address in today’s analysis.
Daily crypto market performance. Source: Coin360.com
Sorry, not sorry… I called it in January
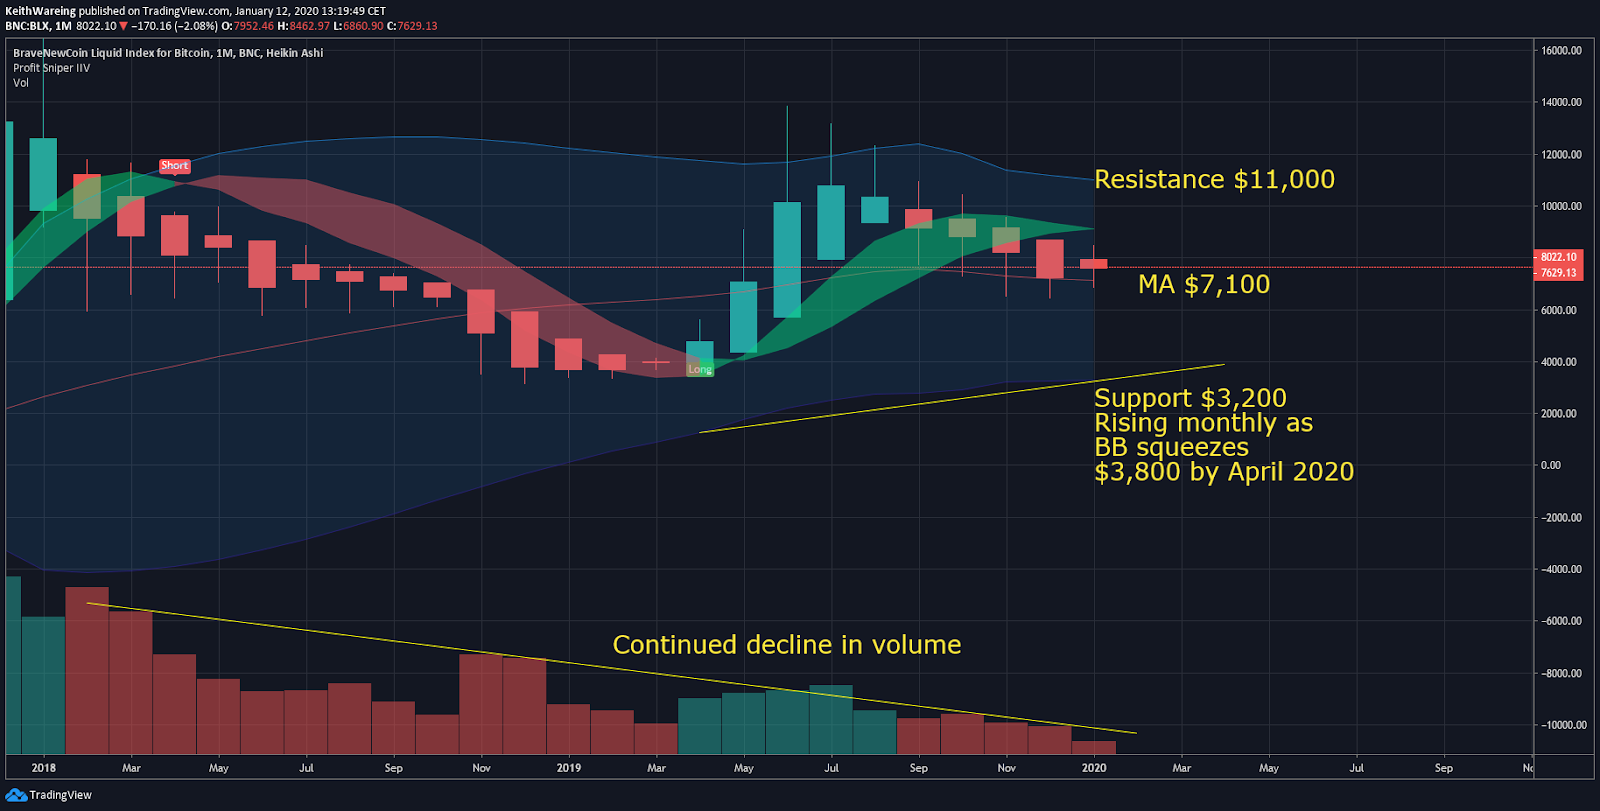
In my analysis that was published on Jan. 12, I put forward the case that Bitcoin could fall to $3,800 by April 2020.
BTC USD monthly chart. Source: TradingView
I came to this conclusion when I realized that the monthly volume had been in a steady decline for several years and that the moving average of the Bollinger Bands on the monthly chart has been broken every month in the last quarter of 2019.
I also saw similar patterns on the monthly and weekly Moving Average Divergence Convergence (MACD) indicator that we had seen back in July 2018, which resulted in BTC price falling from $8,500 to sub $4,000 in a matter of months.
When I mashed these things together it made something abundantly clear, there isn’t enough buying interest in Bitcoin for us to reach new all-time highs.
Oh and I called it again last Sunday
I can already hear the tapping of the angry keyboard warriors hammering down on their Macbooks that I didn’t call anything, and that even a broken clock is right twice a day.
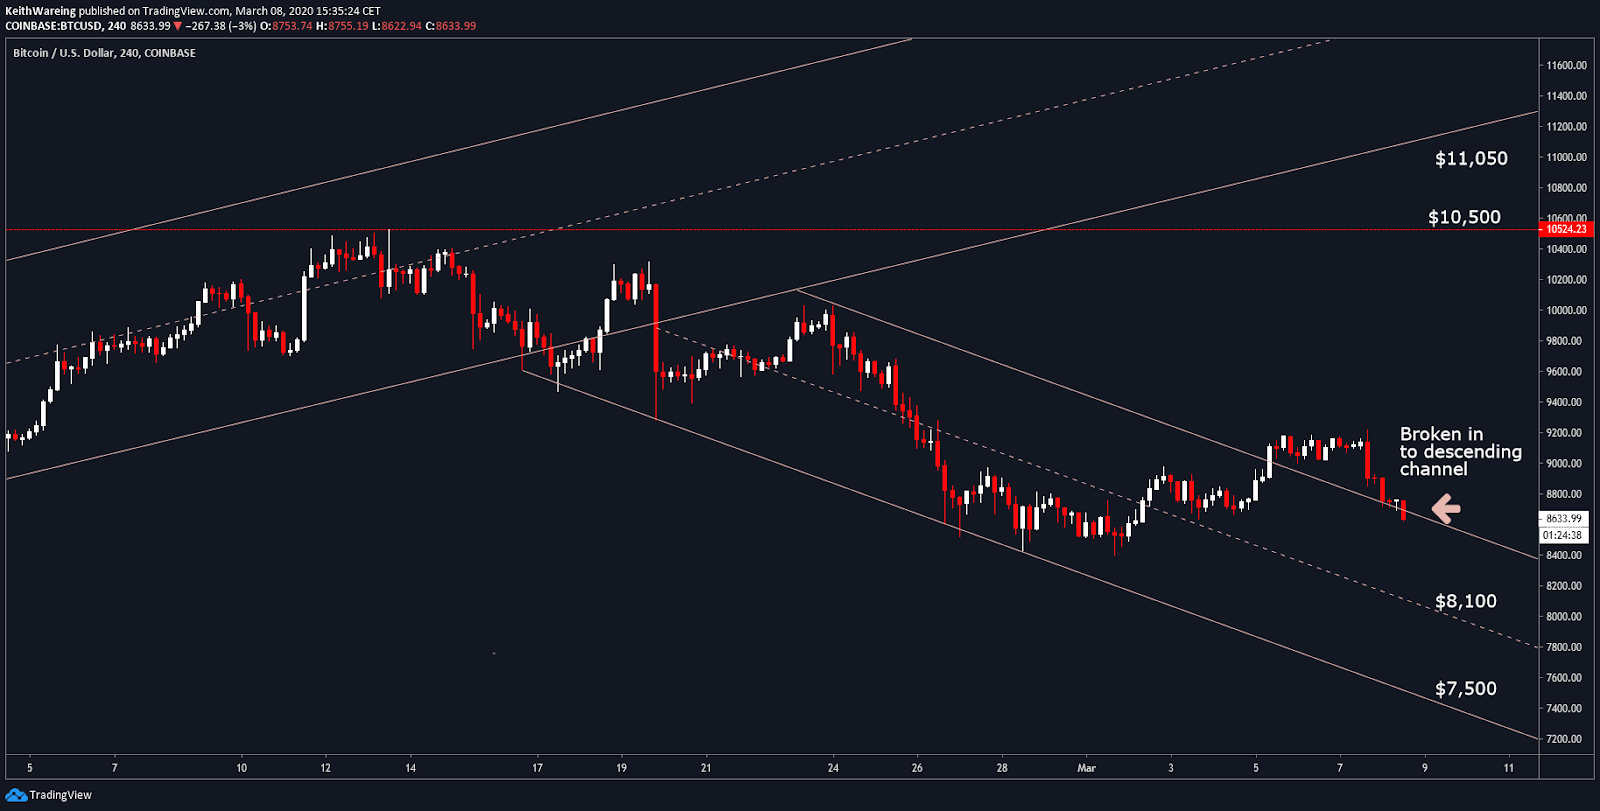
BTC USD 4-hour Source: TradingView
Perhaps, I would draw the same conclusion if I was a small-minded neanderthal that honestly believes my one to three-word comment on Twitter is a valid contribution to an open Bitcoin price discussion.
A discussion that I start every Sunday when I give up valuable time with my wife and three kids in order to deliver my impartial interpretation of the charts. I didn’t mention the $4,000 scenario again because just three days after my analysis on Jan. 15, Bitcoin broke out of the 7-month downtrend channel it had been bouncing around in since the June 2019-Libra FOMO pump.
However, I did mention it again in my analysis last Sunday, since we had fallen into a steep descending channel that was about to break into the previous 7-month downward trend again. In other words, if $7,500 failed to hold there was no support all the way to $4,000
Someone else called it too
Resident gold-bug and renowned Bitcoin-hater Peter Schiff was quick to tweet out something many of us should have taken more seriously.
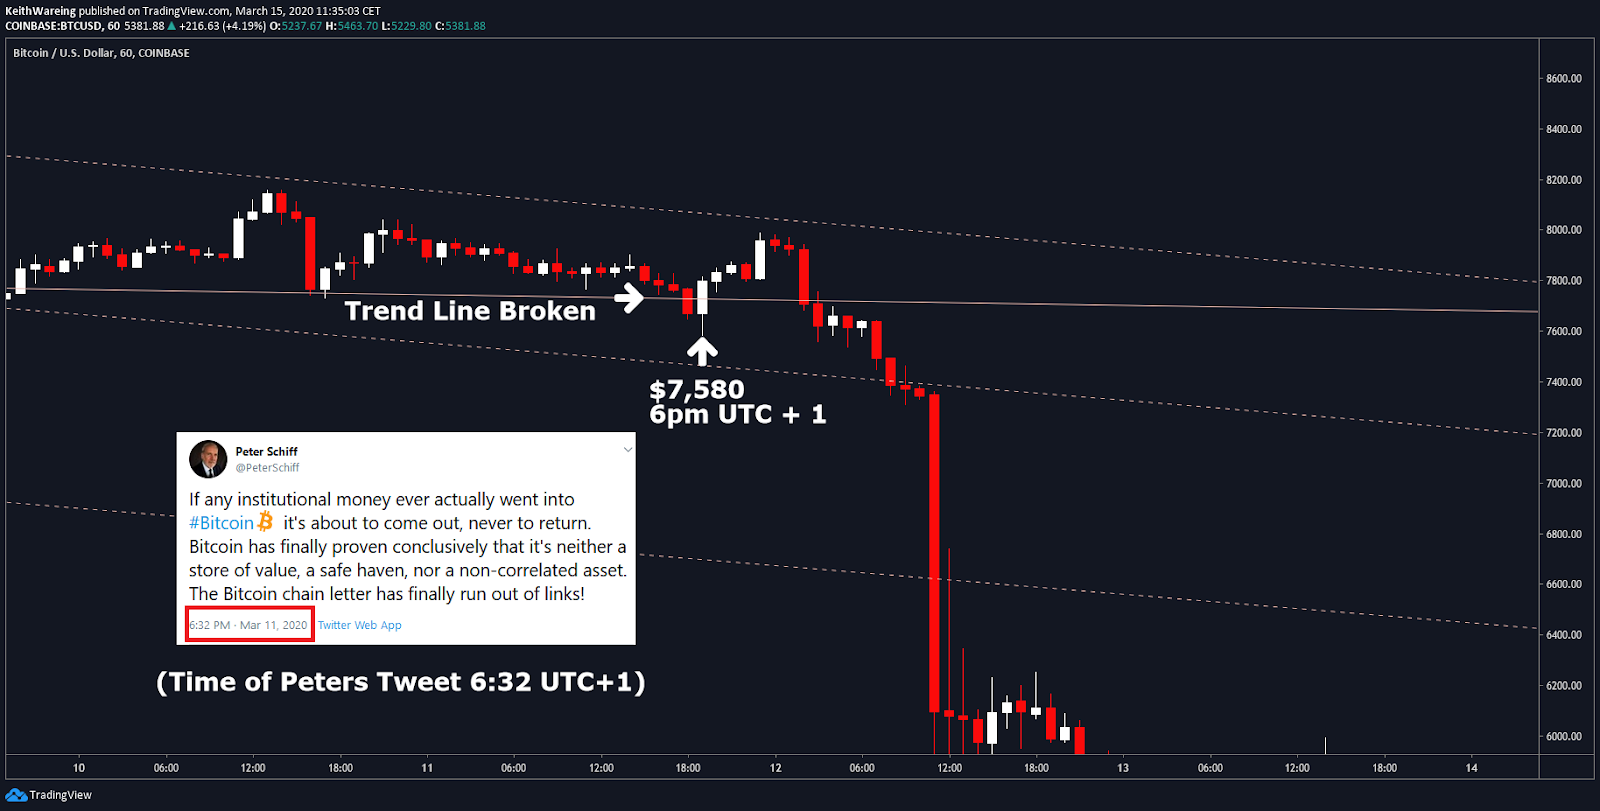
BTC USD 1 hour Source: TradingView
Just 32 minutes after the trendline on the hourly time frame was broken, the same trendline I was looking at on the 4-hour chart just a few days prior, Schiff tweeted the following:
“If any institutional money ever actually went into #Bitcoin it’s about to come out, never to return. Bitcoin has finally proven conclusively that it’s neither a store of value, a safe haven, nor a non-correlated asset. The Bitcoin chain letter has finally run out of links!”
It’s important to understand why Schiff may watch Bitcoin so closely and why he may be so intent on dissuading people from investing in it. Notably, here’s something I haven’t seen anyone mention before.
His bank, Euro Pacific Bank, has a target customer base of high-net-worth individuals looking for offshore tax structures. For a long time, Bitcoin has been seen by some as an alternative place to park your wealth as opposed to exploiting questionable tax loopholes, so it’s clearly in Schiff’s interest to see Bitcoin fail as it directly attacks his business model.
But while I doubt that institutional money is leaving Bitcoin for good, I believe that Peter Schiff’s comment makes sense and that institutions that bought the last 4-month dip where Bitcoin traded between $3,000 and $4,000 knew it was time to exit the market.
If this is the case, it could end one of the popular theories being pushed right now about stocks and Bitcoin being correlated.
Did equity margin calls spark the Bitcoin sell-off?
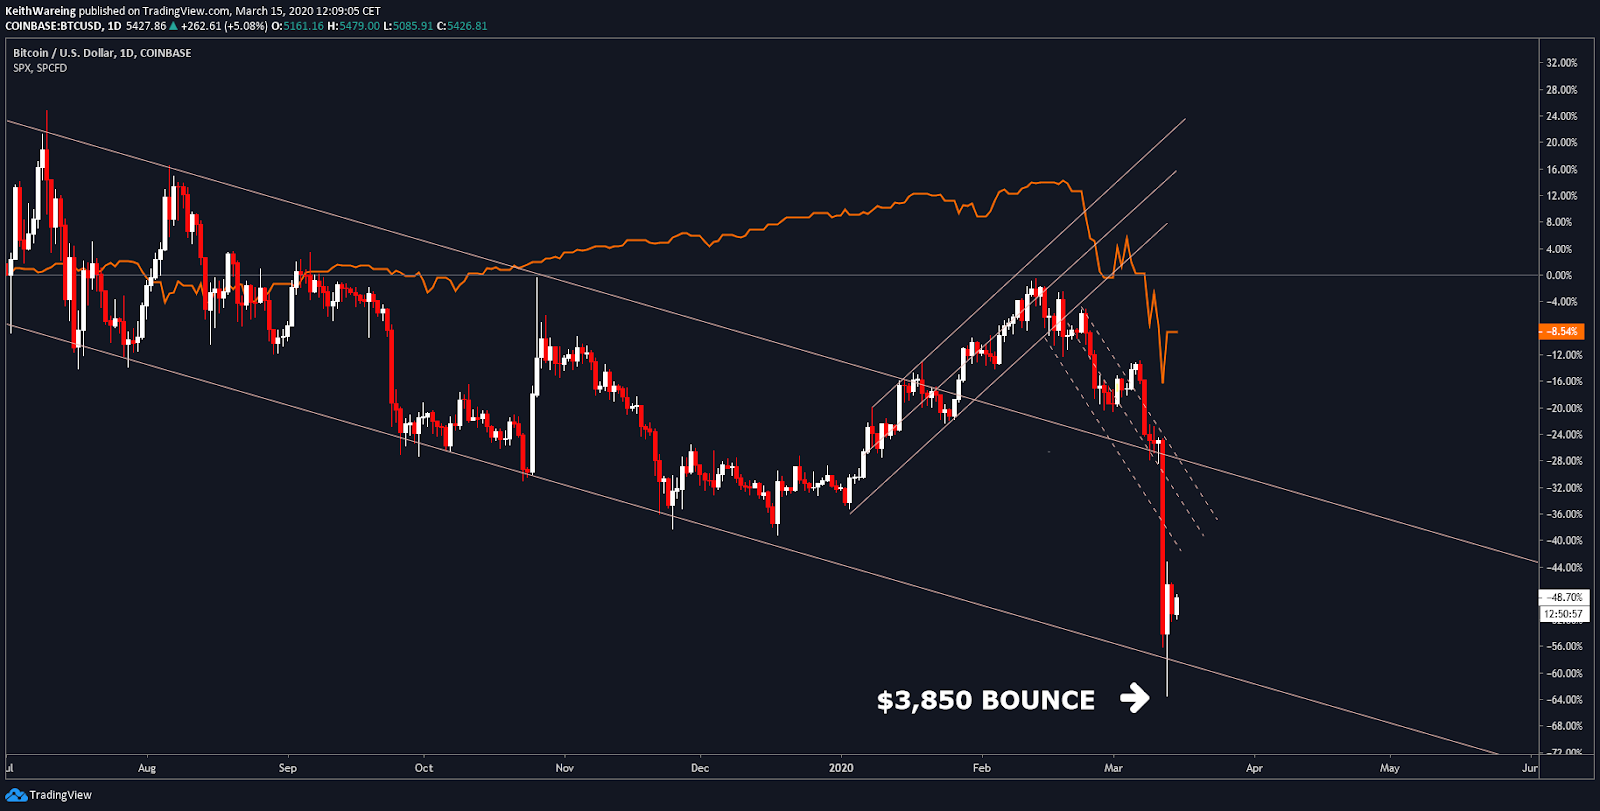
If it’s true that institutional investors just withdrew from Bitcoin, then this bounce from $3,850 might signify that we have not only bottomed, but we might be about to decouple from any possible correlation with the stock market.’
BTC USD/ S&P 500 Daily Source: TradingView
The math is quite simple, the S&P market cap is around $25 trillion versus Bitcoin’s pre-dump market cap of $150 billion. Simply put, institutions stood to lose more from the S&P crashing than from their Bitcoin holdings.
So in the likely event of stock market margin calls as prices began tumbling amidst the coronavirus global panic, what was the fastest liquid asset they could realize?
The answer was most likely Bitcoin. And by all exiting at the same time (because they all had the same reason to exit) you end up with exactly the same situation you get when an ICO gets their team tokens unlocked, i.e. large holders crash the price leaving smaller holders left holding their depleted bags.
Bitcoin’s epic crash gives a few reasons to be optimistic
BTC USD Daily Source: TradingView
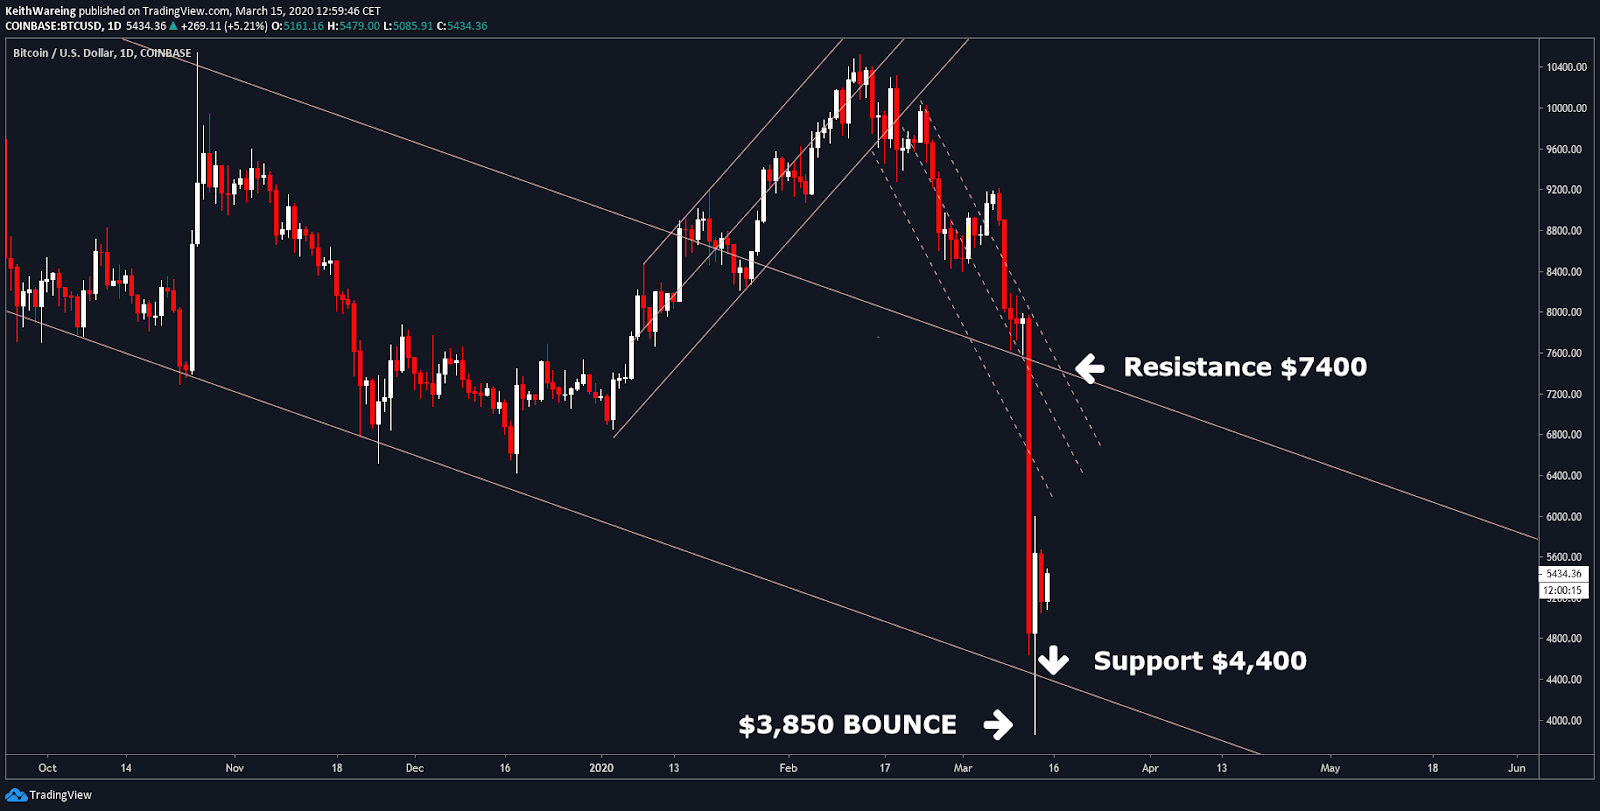
Despite all this blood, there is some light on the horizon. The wick on the bounce from $3,850 has left the support line intact on the daily. This means that the support is currently around $4,400 and will slide to around $4,000 by April 1.
-
True holders are unfazed
However, the resistance to break out of this channel once and for all is currently around $7,400 and will fall to around $7,100 by April 1. So if it’s true that institutional money really has left, then this range will theoretically hold despite any further selloffs in the stock market.
-
Newcomers can now enter at lower prices
This, in turn, should bring confidence back to Bitcoin and create the opportunity for people, who previously thought they were too late to the party, to step in and start buying at fire-sale prices.
-
Future selloffs won’t be as extreme
The reason this is not only good but, in my opinion, great for Bitcoin is that by having Bitcoin held by a large number of small holders as opposed to a small number of large holders, means that it is less likely for a catastrophic sell-off to occur in the future. This will also enable the digital asset to build on its new support level.
Don’t expect these prices to last for months
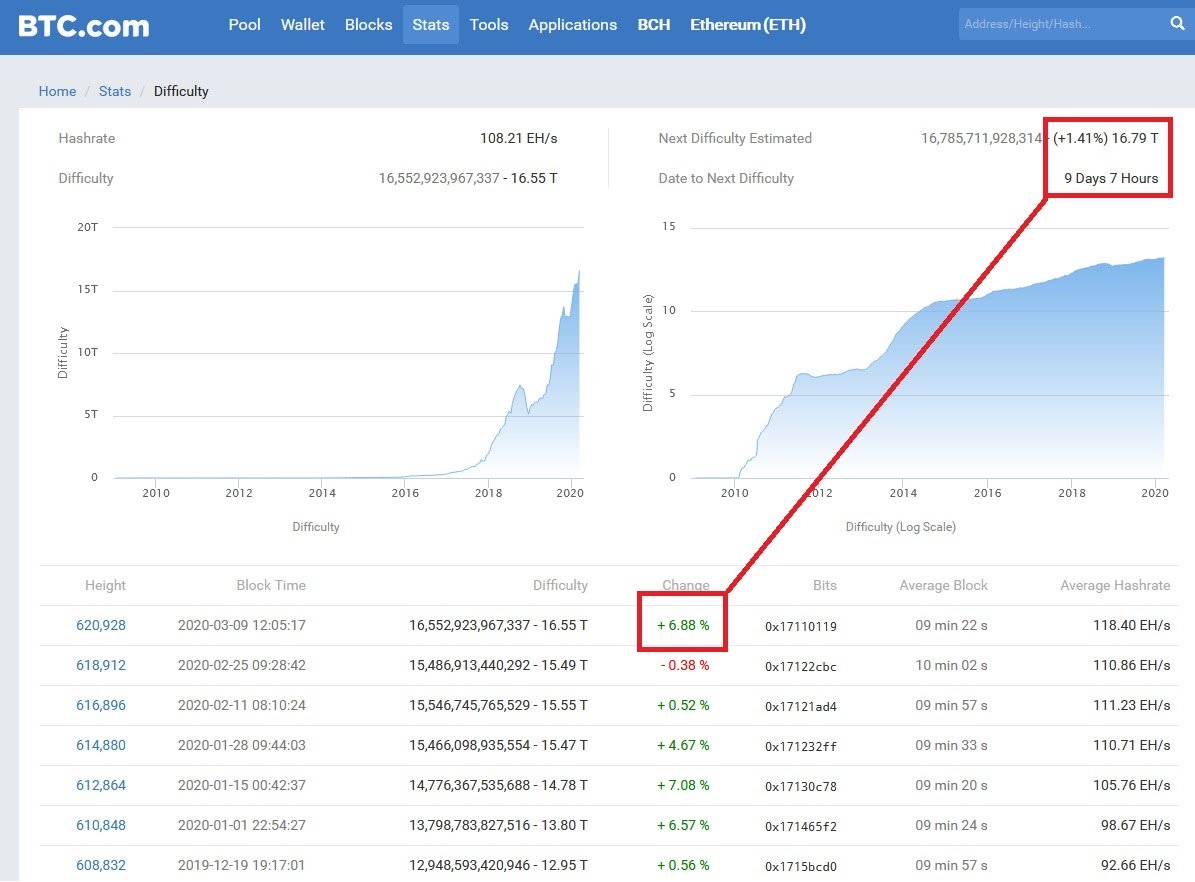
BTC mining difficulty. Source: BTC.com
The mining difficulty is still increasing whilst the price is falling and the halving is only 57 days away. This means that soon any Bitcoins entering the market will be doing so at a much higher rate than the current price as they will have a higher production cost.
It may not happen overnight but when it does, it’s likely to trigger one of the most impressive bull runs that we have ever witnessed, and whilst I don’t personally expect this to happen for at least another 6 months, I also don’t expect these prices to last for long or go much lower.
Bearish scenario
It’s still a very turbulent time for the crypto-sphere as a whole. Should the support of $4,400 ($4,200 by next weekend) fail to hold, then the charts point to $2,450 as the next level of support.
Prices this low would either spark a huge FOMO rally or a further lack of confidence. However, if people have “hodled” through the pain of this past week, I can’t see them selling should $2,450 hit either as this would be capitulating at an obvious bottom.
Bullish scenario
On the bullish side, there is still the CME gap at $9,165, but now that institutions are supposed to have exited the market, it’s unlikely we will see these fills as regularly as we used to. Moreover, it may even lead to a reduction of traders on leverage platforms and a return to spot exchanges. In other words, an early “alt season” may then become a possibility as people attempt to regain their losses by speculating on altcoins again.
The resistance levels to break now are $7,400 and then $8,000 before opening up $11,250 as the next target that would put Bitcoin on the same upward path it broke into on January 15.
The views and opinions expressed here are solely those of @officiallykeith and do not necessarily reflect the views of Cointelegraph. Every investment and trading move involves risk. You should conduct your own research when making a decision.


