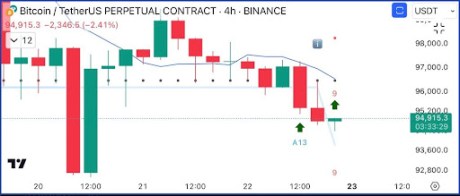
Bitcoin was rejected near the $10,500 area against the US Dollar. BTC could extend its decline as Ethereum and ripple are down more than 10%.
- Bitcoin price is under pressure below the $10,000 support area against the US Dollar.
- The bears seem to be in control as the price even failed to stay above $9,800.
- There is a short term declining channel forming with resistance near $9,900 on the hourly chart of the BTC/USD pair (data feed from Kraken).
- Ethereum and ripple are gaining bearish momentum and are down 11% and 15% respectively.
Bitcoin Showing Bearish Signs
After a strong rejection near the $10,500 area on two occasions, bitcoin price started a fresh decrease against the US Dollar. BTC price broke a few key supports near $10,200 and $10,000 to enter a bearish zone.
Moreover, there was a close below $10,000 and the 100 hourly simple moving average. The price even failed to stay above the $9,800 support area and it declined towards the $9,600 support.
A swing low is formed near $9,632 and the price is currently correcting losses. It surpassed the 23.6% Fib retracement level of the recent slide from the $10,400 high to $9,632 low.
However, bitcoin is facing hurdles near the $9,900 and $10,000 levels. More importantly, there is a short term declining channel forming with resistance near $9,900 on the hourly chart of the BTC/USD pair.
Besides, the 50% Fib retracement level of the recent slide from the $10,400 high to $9,632 low is near the $10,000 area to act as a key resistance. The main resistance for bitcoin is near the $10,120 level and the 100 hourly simple moving average.
Therefore, a successful break above $10,000 and then a follow up move above the 100 hourly simple moving average is needed for a fresh increase towards $10,500 in the near term.
More Losses As Ethereum and Ripple Plunge?
As mentioned, Ethereum and ripple are declining heavily, which may perhaps increase pressure on bitcoin below $9,800. If it slides below the $9,600 support, the bears could even aim a break below the key $9,500 support level.
Finally, a convincing break below the $9,500 area is likely to set the momentum for a run towards the $9,000 level.
Technical indicators:
Hourly MACD – The MACD is slowly gaining pace in the bearish zone.
Hourly RSI (Relative Strength Index) – The RSI for BTC/USD is currently well below the 50 level.
Major Support Levels – $9,600 followed by $9,500.
Major Resistance Levels – $10,000, $10,100 and $10,120.


