The total crypto market cap lost $20.5 billion from its value for the last seven days and now stands at $225.5 billion. The top 10 currencies are all in red for the same time frame with Bitcoin SV (BSV) and Bitcoin Cash (BCH) being the worst performers with 16.8 and 15.3 percent of losses respectively. By the time of writing bitcoin (BTC) is trading at 7,759 while ether (ETH) moved down to $197. Ripple’s XRP fell to $0.202.
BTC/USD
Bitcoin closed the trading day on Sunday, March 1 without any significant changes in price as it remained in the zone around $8,530 after another failed attempt fro bears to break the $8,400 support.
The most popular cryptocurrency started the new trading week positively. It once again moved above the 200-day EMA on Monday, March 2, successfully preserving the uptrend corridor. The coin added 4.7 percent to its value and climbed up to $8,918 in its best session for the last 14 days.
On Tuesday, the BTC/USD pair was rejected right below the previously stable support around Fibonacci retracement level 38.20 ($8,934). It fell down to $8,760.
The mid-week session on Wednesday was a little less volatile. The coin was moving in the $8,854 – $8,654 range during intraday but remained flat at the end of the session.
On Thursday, March 5, bitcoin formed a solid green candle and climbed all the way up to $9,072. It peaked at $9,172 during intraday and added 3.4 percent to its value, successfully returning to the previously marked support area.
The last day of the workweek was a confirmation of the previous session as BTC stabilized above $9,000 and closed with a small gain to $9,161.
The weekend started with a serious price correction to $8,894 on Saturday, March 7 and the leading cryptocurrency could not extend its gains.
It’s worth noting that the coin was ranging in the $8,200 – $8,400 zone for more than a week in late January and early February.
On Sunday, the BTC/USD pair nosedived to $8,027 in its worst session so far this year. It erased 9.7 percent of its value and was looking for a break of the important $8k level.
The coin is trading below the above-mentioned level in the early hours of trading on March 9.
ETH/USD
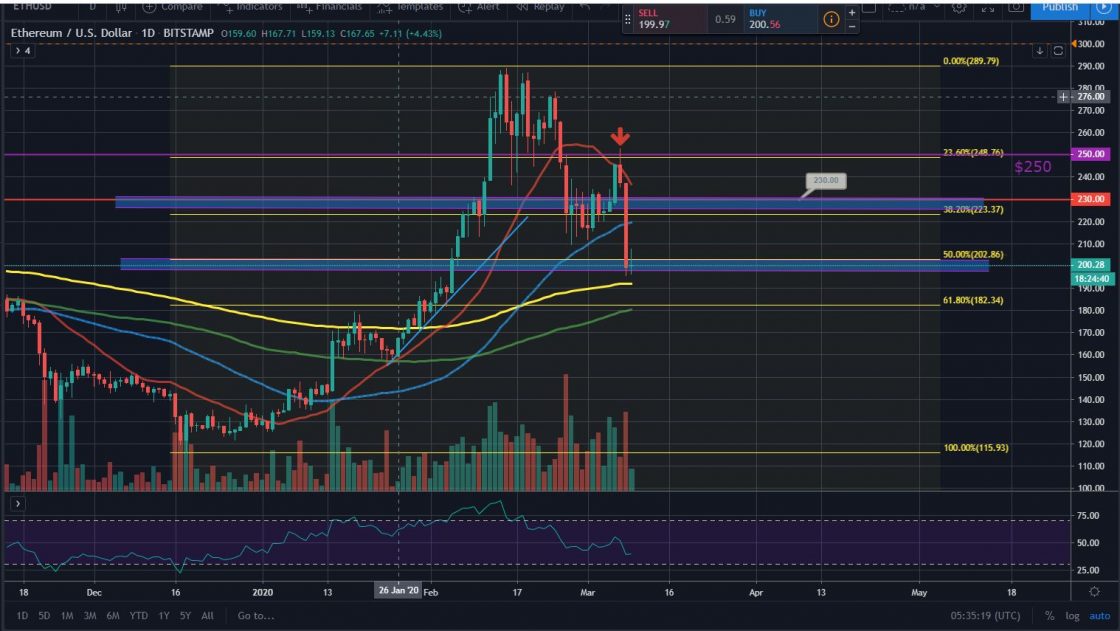
The Ethereum Project token ETH formed a third consecutive red candle on the daily chart on Sunday, March 1 and ended the session at $217.
The ETH/USD pair opened the new trading period by skyrocketing all the way up to $235. The coin added 8.7 percent to its value and returned back above the stable $222- $225 support zone.
On Tuesday, March 3, the ether made a correction and fell back to the low end of the mentioned area. It ended the session exactly at $222.
The third day of the workweek came with no significant price movements. The coin was trading in the $220-$228 range and closed with a small gain to $224.
On Thursday, March 5 it climbed up to $227 and stabilized in the middle of the support zone. Bulls even managed to push the price to $234 during intraday.
Already in an uptrend, the ETH token registered some solid gains on Friday and reached $245 while adding 8 percent to its value.
On the first day of the weekend however, the altcoin was rejected in the zone between the Fibonacci 50 percent line at $247 and the psychological level at $250. The ether corrected its price down to $237.
On Sunday it followed the general crypto market trend and Bitcoin and crashed down to $200. The ETH/USD pair lost 15 percent of its value as bulls will be looking for support at the 200-day EMA combined with the horizontal support of the above-mentioned important level.
The ether was 7.4 percent down for the seven-day period.
XRP/USD
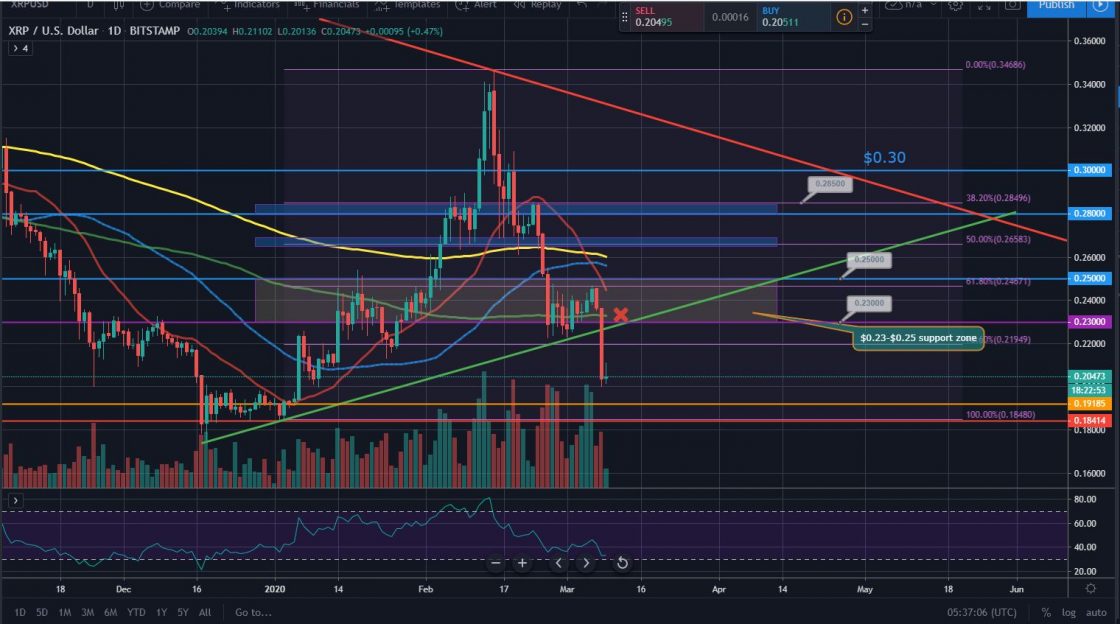
The Ripple company token XRP made another step back on Sunday, March 1, this time to $0.226, and ended the seven-day period with a 20 percent decrease.
The coin started trading on Monday by creating a green candle to $0.239, touching the upper end of the downtrend channel. The move resulted in a 5.7 increase as the XRP/USD pair successfully re-entered the previously stable support zone between $0.23-$0.25.
On Tuesday, March 3, the XRP/USD pair fell down to $0.233, still, it avoided major corrections and kept moving above the mid-term uptrend. The session was followed by a low-volatility one on Wednesday as the “ripple” remained flat in the $0.233 area.
On Thursday, March 5, the coin once again moved up to $0.239. Bulls were already looking at $0.25 as their next stop before $0.285.
The last day of the workweek found XRP extending its gains. The major altcoin continued with its good performance and ended the day at $0.245, but not before touching the 61.80 Fibonacci level at $0.246 during intraday.
The weekend of March 7-8 started with a rejection around the above-mentioned level. The XRP/USD pair dropped down to $0.235 and erased 4 percent of its value.
On Sunday, it fell down to $0.203 loosing the stunning 14 percent in a single session.
Altcoin of the Week
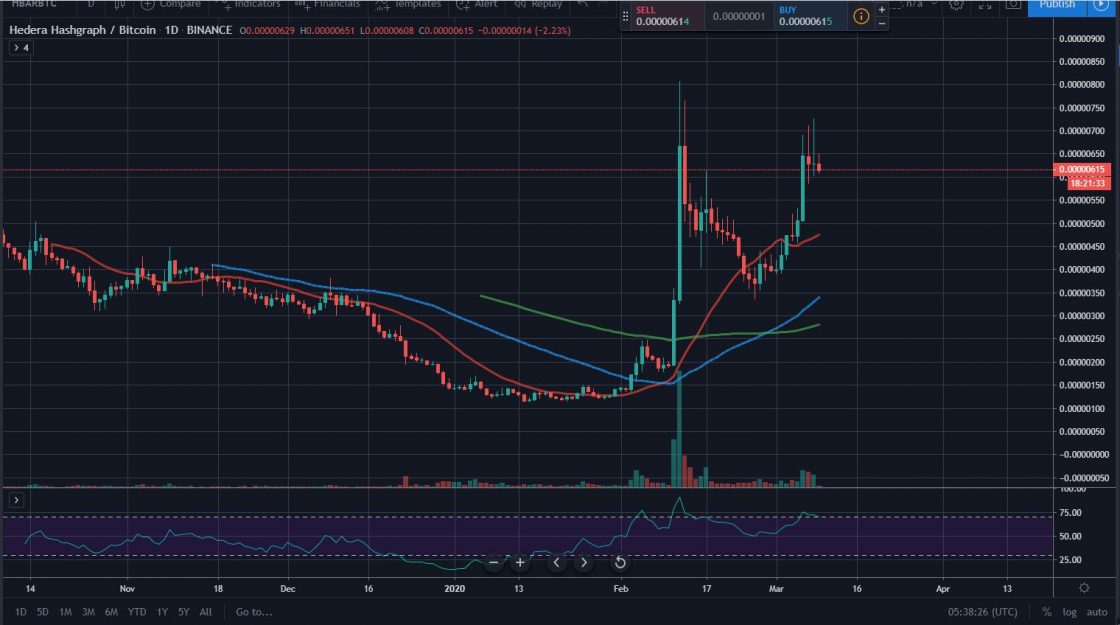
Our Altcoin of the week is Hedera Hashgraph (HBAR). This innovative crypto project, which is also sometimes referred to as “the 3rd generation public ledger” added 69 percent to its value for the last seven days and is already 182 percent up on a monthly basis.
The HBAR peaked at $0.063 on Saturday, March 7 and is currently ranked at #36 on CoinGecko’s top 100 chart with a total market capitalization of approximately $197 million.
As of the time of writing, the coin is trading at 0.00000615 against BTC on the Binance daily chart.
Like BTCMANAGER? Send us a tip!
Our Bitcoin Address: 3AbQrAyRsdM5NX5BQh8qWYePEpGjCYLCy4


