Bitcoin (BTC) price has started to show strength in its recovery since the black Thursday selloff this past week, but is this something we can expect to continue? Or is this a dead cat bounce on the way down to lower lows?
In today’s analysis I’m looking not only at the charts, but also at the possibility of large Bitcoin miners being the cause of the 50% price drop on March 12, after supporting data emerged last week suggesting that short-term holders sold a whopping 281,000 BTC, which resulted in the crash.
Daily crypto market performance. Source: Coin360.com
Did miners dump over a quarter of a million BTC?
In an article published by Coinmetrics on March 17, on-chain data supported the fact that short-term BTC holders were most likely responsible for the selling rather than new holders.
The figures they quoted included 281,000 BTC was on the move after 30 days of holding, compared to 4,131 that hadn’t been touched for over a year before being moved.
This data might suggest to some that it was weak hands that FOMO bought in during Bitcoin’s 30% price rise at the beginning of 2020. However, one has to consider the possible motives at play for such a large amount of Bitcoin being sold off cheap.
This to me opens up the very real possibility that the same people responsible for Bitcoin’s price rise this year, were the same people responsible for its fall.
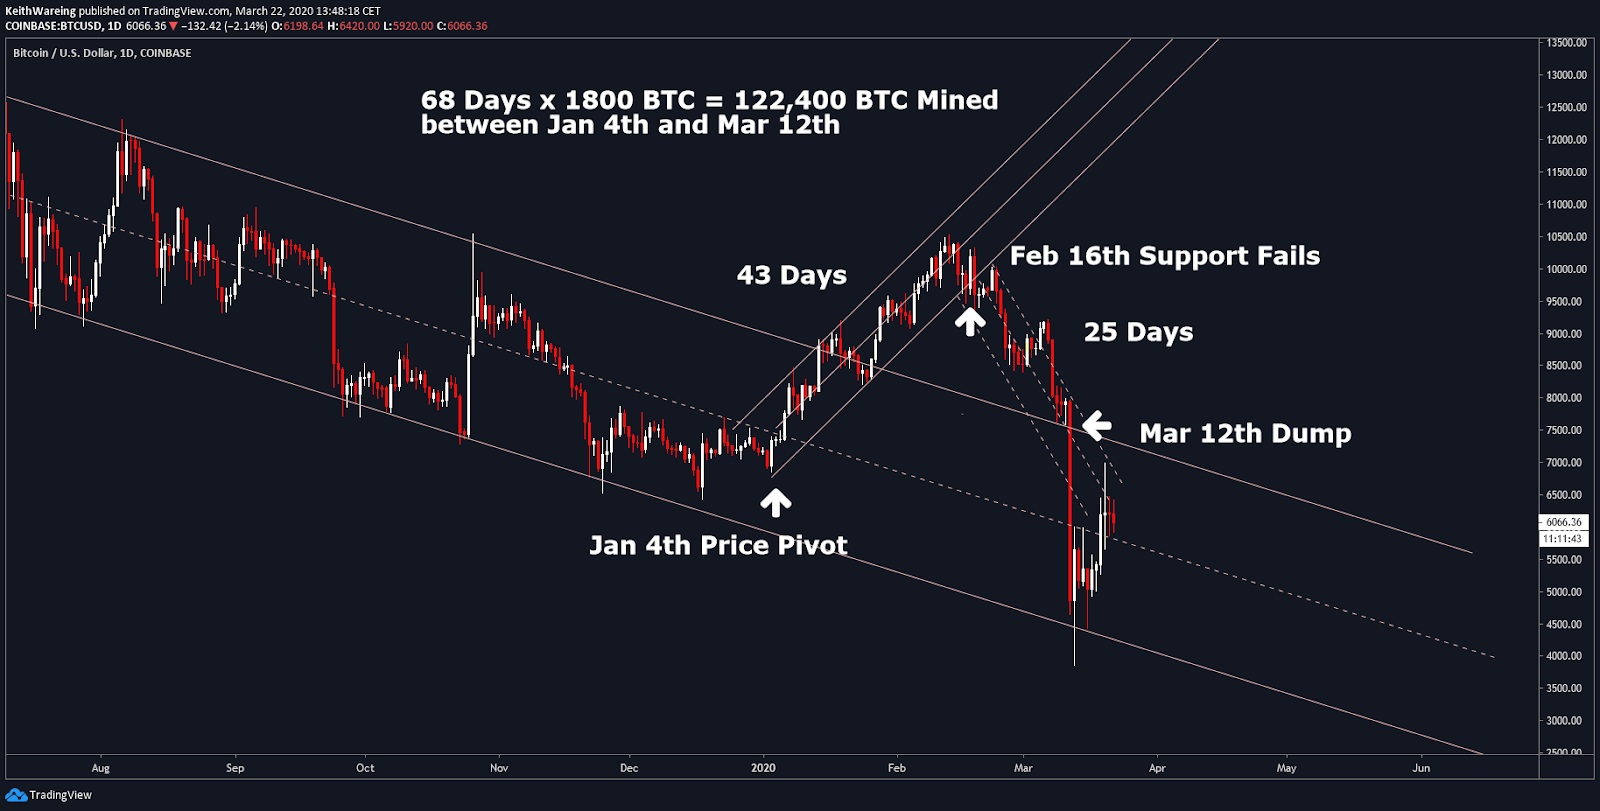
As can be seen in the chart below, Bitcoin had been trending in a downward parallel channel since June 2019 — a trend that seemed to bottom on Jan. 4, 2020, which saw the Bitcoin price take off in a new ascending channel.
This new impetus for Bitcoin’s price was welcomed, but not questioned. Why did Bitcoin start to rise? Was it the upcoming halving, which is now just 51 days away? Was it the mining difficulty increase? Was it renewed institutional interest? However, what if it was all of these things combined, but with a twist.
What if the miners stopped selling Bitcoin?
There are 1,800 new Bitcoins mined every day, and between the period of Jan. 4 and Mar 12, there would have been 122,400 Bitcoin mined. This is about 50% of the amount that was revived by short term holders, and you don’t get more short term than freshly mined BTC.
BTC USD daily chart. Source: TradingView
Why would miners crash the market?
I’m not going to pretend that I know any of this for a fact, this is just a theory with a lot of supporting data. But I will throw a few reasons that would make sense for larger miners to crash the market before continuing with my analysis.
- To liquidate leveraged competitors (many smaller miners hedge on leverage platforms like Bitmex);
- To increase their market share ahead of the halving (because of the above);
- To shake out big manipulators (PlusToken scammers, Institutional investors) prior to the halving.
I believe the above to be plausible reasons, especially if you consider how much hashing power comes out of China, a nation that pretty much has a crystal ball when it comes to the Coronavirus outbreak, as the first cases where being reported there back in November 2019.
This almost creates a perfect storm of conditions to execute the black swan event that was able to simultaneously gain dominance in the market, and regain control of the price. After all, if miners have no control over the price, then the halving will have no impact.
If in doubt, zoom out
BTC USD daily chart Source: TradingView
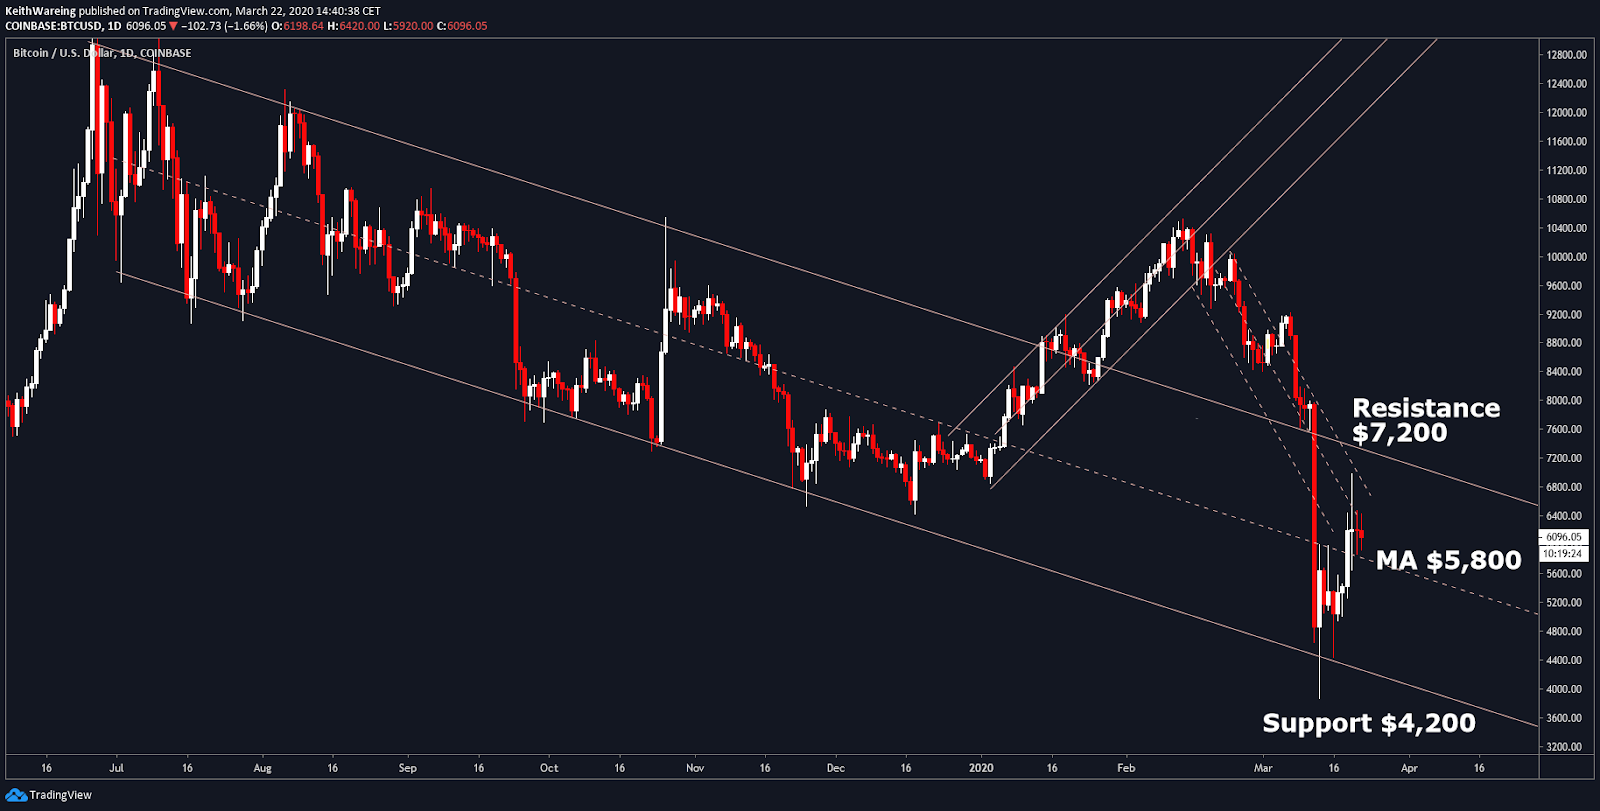
When you zoom out on the Bitcoin 1-day chart, it’s almost obvious where miners could have stopped selling. The breakout at the beginning of the year just looks like a bump in the road, as we have since resumed the same downward channel we were in for the entire second half of 2019.
We’ll never really know whether or not the above scenario is true because of the selloff. However, one thing that is definite is that the price bounced off the support of the descending channel at $4,400 as anticipated in last week’s analysis, so I am keeping these levels in mind looking forward to the week ahead.
At present, the price is holding above the middle of the channel, which is around $5,800. However, should this level fail to hold, then I expect $4,200 to be tested next week.
Should $5,800 continue to hold, then $7,200 is the key level of resistance for Bitcoin to push past and flip to support to be rid of this descending channel once and for all.
Mining difficulty reduction
BTC mining difficulty. Source: BTC.com
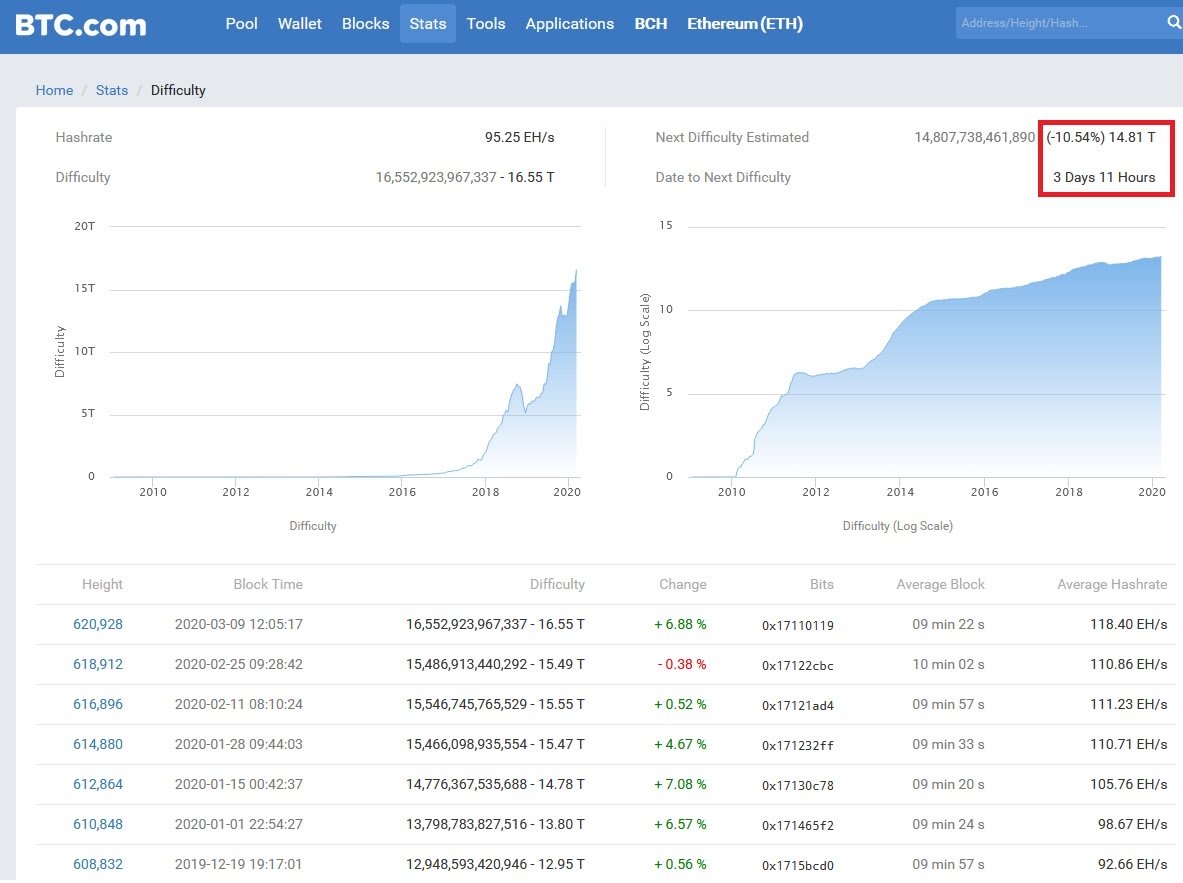
Since the beginning of 2020, we have largely had the mining difficulty increase. This, in turn, seemingly saw the price rise, and as such, it seemed like a valid indicator.
However, next week we are set to see the year’s first double-digit adjustment, and unfortunately, it’s a negative one of -10.54%. Only time will tell if this will have a negative impact on the price of Bitcoin.
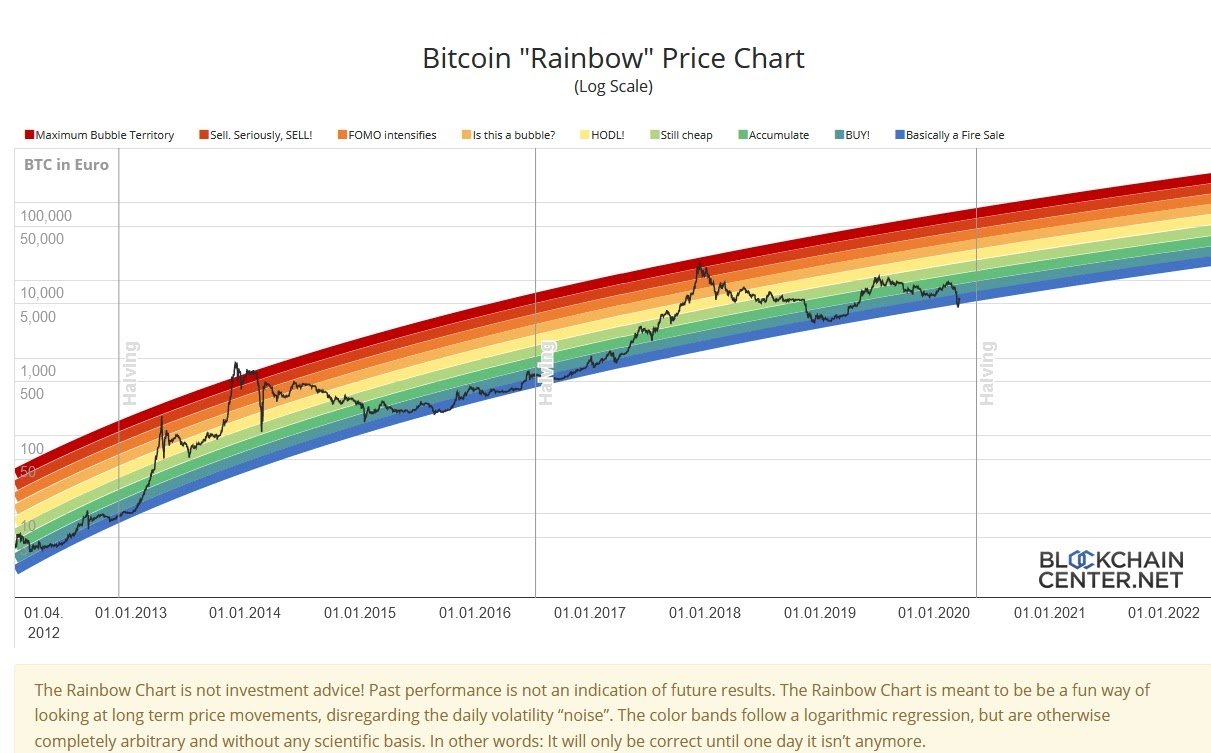
The yearly trend suggests that it might also just be correcting itself after such a dramatic selloff on the day it last increased. Bitcoin has a history of punishing its holders prior to big rewards, and the next chart might help you visualize what could be in store over the coming weeks and months.
BTC Rainbow Chart Source: Blockchain Centre
Similar to the stock to flow ratio chart, only this one I feel helps convey an important message, and that message is “Keep buying Bitcoin at these levels.”
Whilst this chart isn’t intended to be financial advice, and like the S2F model has most likely been based on hindsight, what it does show is potentially how long we might remain in the blue “fire sale” zone both ahead and beyond the halving.
As a Bitcoin hodler and trader, I take great comfort in one thing shown on this chart. There are many more buying opportunities than there are selling opportunities, so should the price of Bitcoin continue to slide next week, try to view it as an opportunity to buy more, rather than reflecting on how much of a rekt pleb you feel right now.
Bullish scenario
I said it last week, I’ll say it again, the CME gap still exists at $9,165. Whilst it feels almost impossible right now, 90% of CME gaps still fill, so there’s always a possibility.
However, being more realistic and looking at the week ahead, if Bitcoin can hold $5,800 as support then all eyes are on $7,200 as the key level to break out from.
From here, I would expect the next level of resistance to be present around $8,000 before we can even start to think about $10,000 again.
Bearish scenario
We can’t completely ignore all the global turmoil right now. Thus, if $5,800 fails to hold, I think it’s highly probable that we will revisit $4,200.
Falling below $4,200 is not a scenario I believe we need to consider. However, if this were to break, then $2,760 would be the last level of support I’d be looking at, as this would represent an 80% retracement from last year’s high of $13,800. If it fails to bounce there, then I would completely expect Bitcoin to go to sub $1,000 levels.
The views and opinions expressed here are solely those of @officiallykeith and do not necessarily reflect the views of Cointelegraph. Every investment and trading move involves risk. You should conduct your own research when making a decision.


