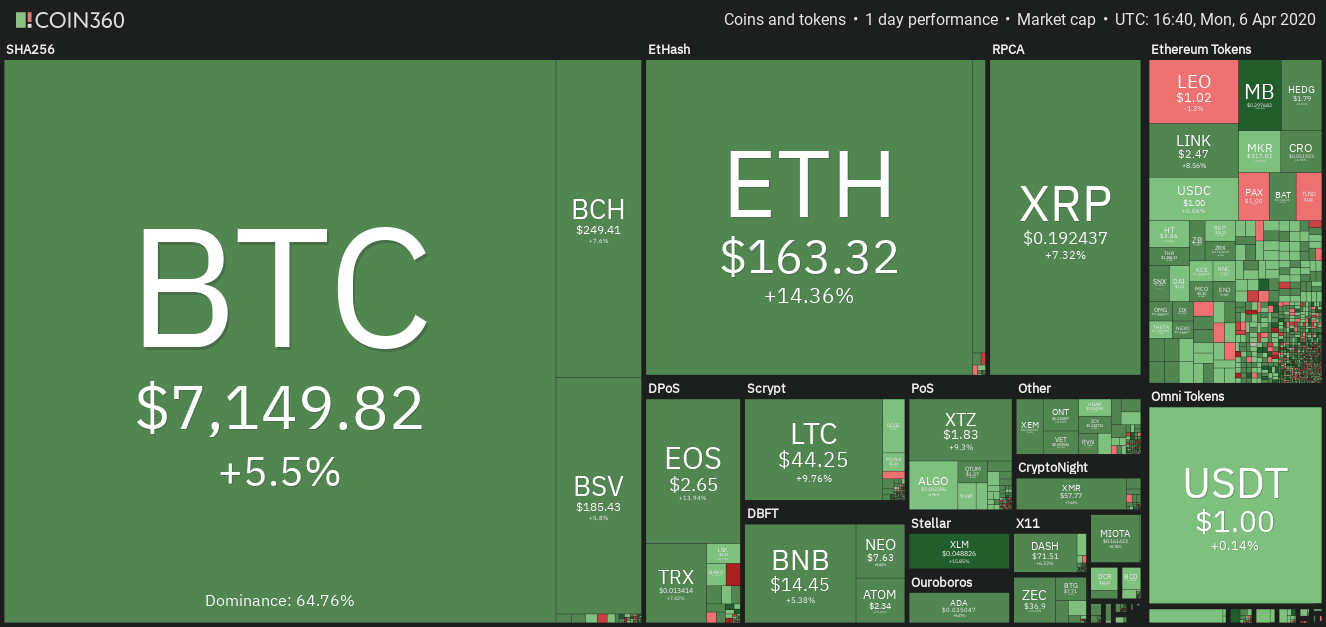
Many major cryptocurrencies are breaking out of their critical overhead resistance levels and it seems the uptrend is likely to continue for the next few days.
During a crisis, the first thing panic-stricken investors do is to sell almost every asset class they perceive is likely to go down. However, after the panic settles down, the bottom fishers step in and start buying the assets that show value. We have seen both of these phases play out for cryptocurrencies.
The sharp selloff on March 12 was a good example of panic and the sharp correction was quickly followed by a phase of cherry-picking by long-term investors. Since bottoming out on March 13, most major cryptocurrencies have rebounded and continue to press higher.
After the selling ends, the markets begin to react to positive news. Currently, several asset classes like the equity markets, gold, and cryptocurrencies are moving up in unison as the market participants believe that the worst of the coronavirus pandemic in Europe and the US is likely behind us.
Daily cryptocurrency market performance. Source: Coin360
Equities markets could be going up because of the huge stimulus measures that have been announced by central banks across the world. For the same reason, gold is also going up because money printing will eventually reduce the purchasing power of fiat currencies and could also lead to a financial crisis in the future.
Some believe that the central banks have no bullets left to fight the next crisis and this will result in a move away from fiat. Also, the additional liquidity will have to go somewhere. With crypto prices still way below their highs, they could possibly offer an attractive investment opportunity.
As normalcy returns, the crypto markets will start focusing on its fundamentals. News and events like the development of central bank digital currencies (CBDCs), the upcoming Bitcoin halving and other crypto-related events will start influencing crypto price action again.
BTC/USD
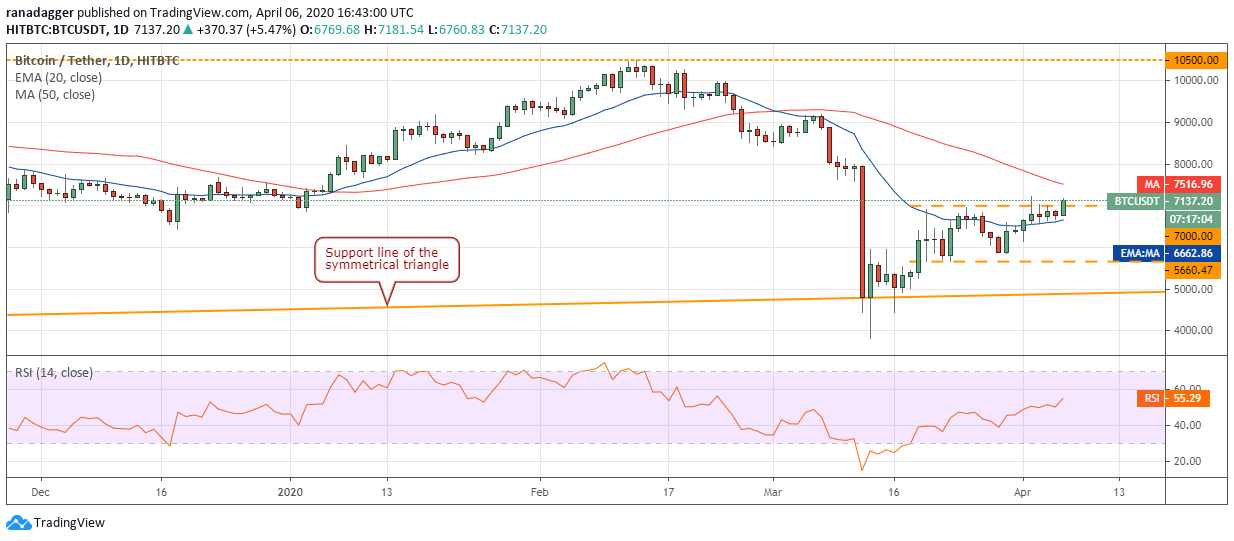
Bitcoin (BTC) has again broken out of the overhead resistance at $7,000. If the bulls can sustain the price above this level, a rally to $8,000 and above it to $9,000 is possible.
BTC–USD daily chart. Source: Tradingview
However, the bears might not throw in the towel without a fight. They are likely to defend the 50-day SMA at $7,517. If the BTC/USD pair turns down from this level but finds support above $7,000, it will signal a higher floor.
Our bullish view will be invalidated if the pair turns down from the current levels or the 50-day SMA and breaks below $6,553.21. The traders can trail the stops higher to $6,500 after the pair scales above the 50-day SMA. Until then, the stops on the long positions can be maintained at $5,600.
ETH/USD
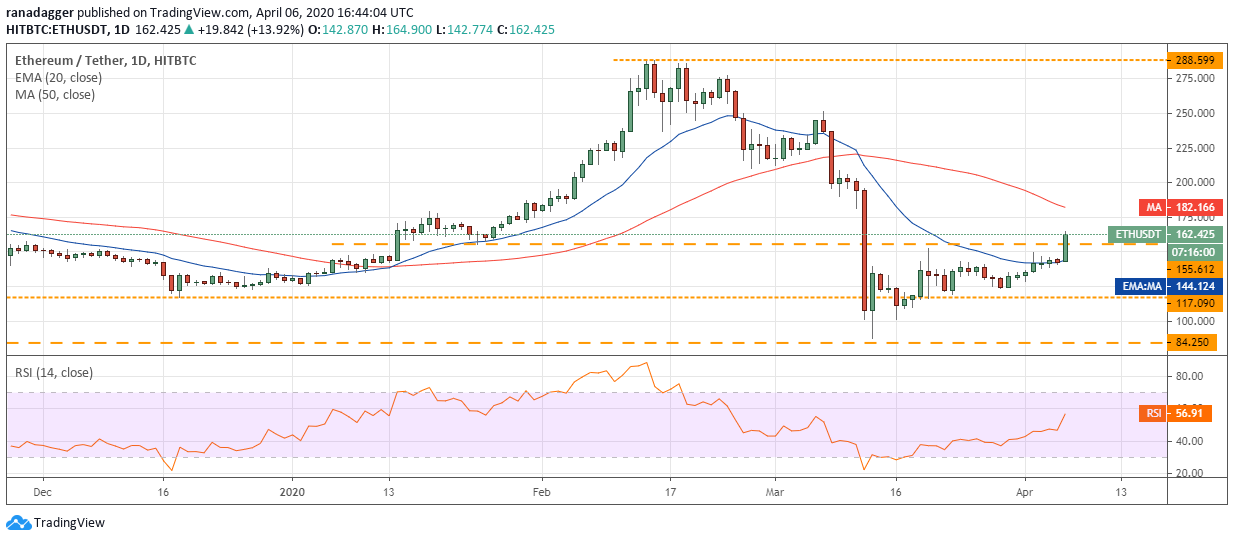
Ether (ETH) has broken out of the overhead resistance at $155.612. If the price can close (UTC time) above this level, it will trigger our buy suggested in an earlier analysis. The first target is a move to the 50-day SMA at $182.
ETH–USD daily chart. Source: Tradingview
If the momentum can push the ETH/USD pair above the 50-day SMA, a rally to $208.50 and above it to $250 is likely.
Our bullish view will be invalidated if the pair turns down from the current levels or the 50-day SMA and plunges below the critical support at $117.090.
XRP/USD
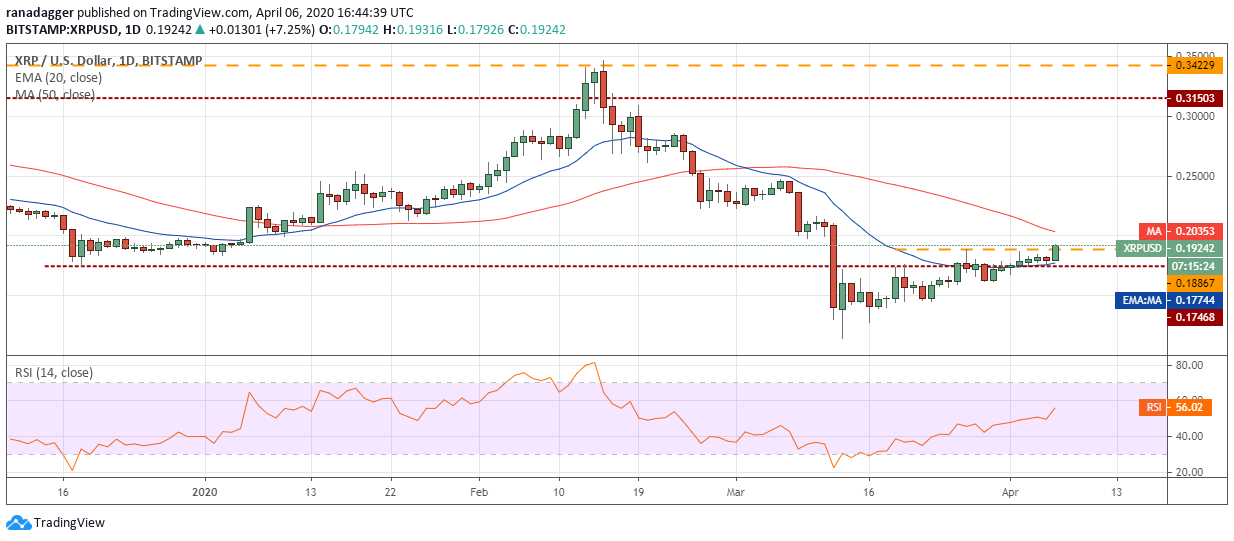
XRP has broken above the overhead resistance at $0.18867. If the bulls can sustain the altcoin above this level, it will signal strength. There is a minor resistance at the 50-day SMA ($0.20) and above this level a rally to $0.25 is possible.
XRP–USD daily chart. Source: Tradingview
Our bullish view will be negated if the buyers fail to sustain the XRP/USD pair above $0.18867. In such a case, the bears will try to sink the pair back below $0.17468. If successful, a drop to $0.15708 is possible.
For now, the stops on the long positions can be trailed higher to $0.155. We will suggest trailing the stops higher again after the price sustains above the 50-day SMA.
BCH/USD
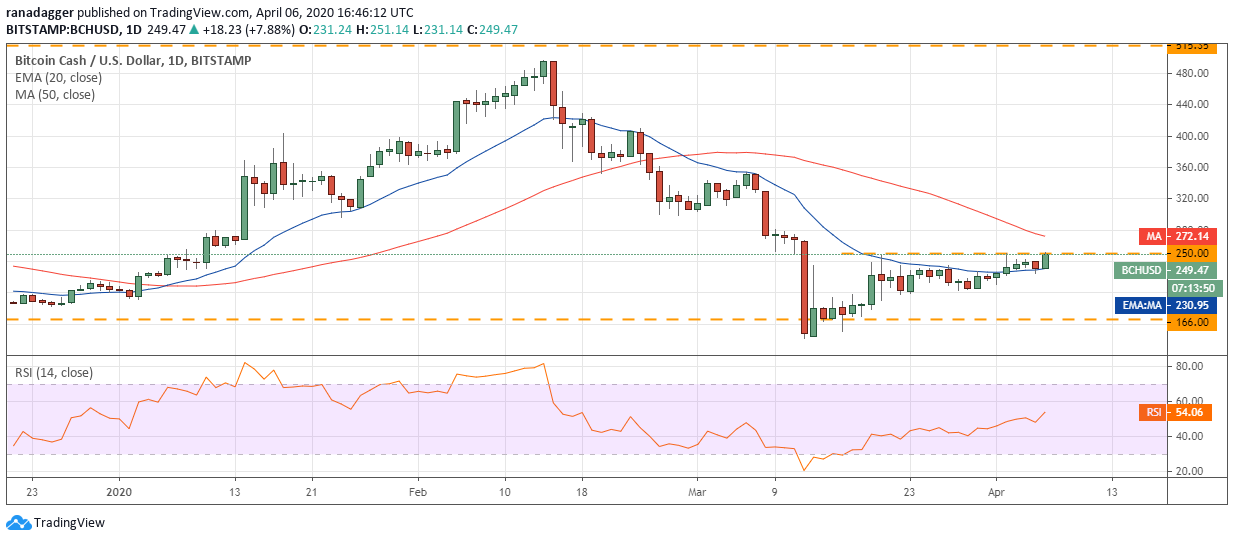
After trading between the 20-day EMA and $250 for the past few days, the bulls are currently attempting to propel Bitcoin Cash (BCH) above $250. If successful, we anticipate a breakout that can carry the altcoin to $350.
BCH–USD daily chart. Source: Tradingview
The bears are likely to offer resistance at the 50-day SMA at $272 but we expect this level to be crossed. Hence, traders can initiate long positions as proposed by in an earlier analysis.
Contrary to our assumption, if the BCH/USD pair reverses direction from the 50-day SMA and breaks below $222.43 it will signal weakness.
BSV/USD
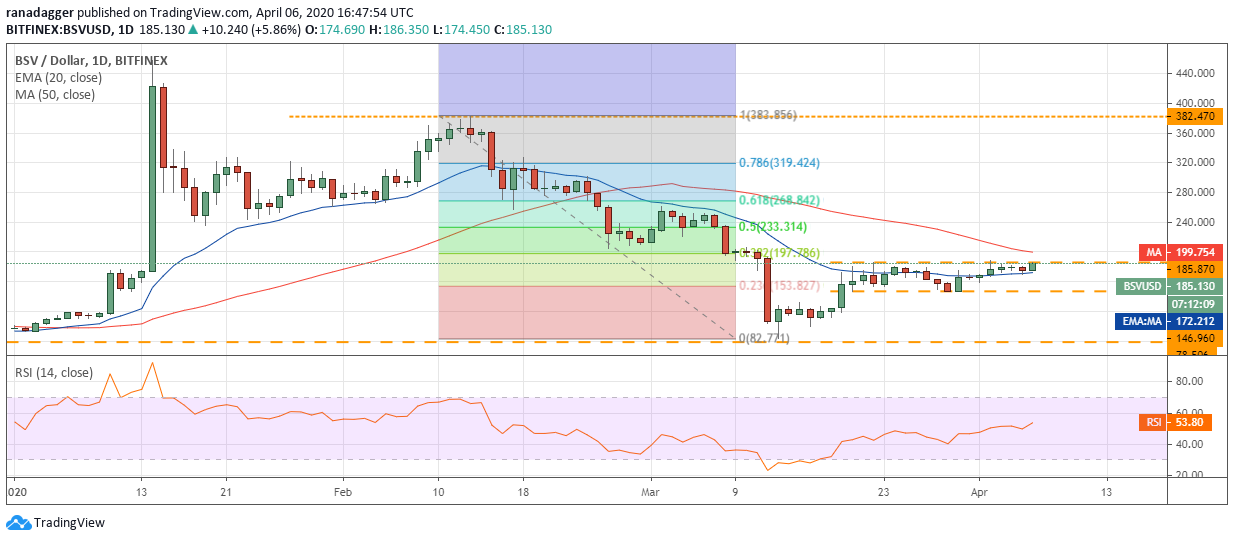
Bitcoin SV (BSV) has been stuck between $185.87 and the 20-day EMA for the past few days. This consolidation in a tight range is a positive sign as it increases the possibility of a breakout above the overhead resistance.
BSV–USD daily chart. Source: Tradingview
On a break above $185.87, the bulls might again hit a hurdle at the 50-day SMA, which is close to $200. However, if the altcoin can clear this resistance, the BSV/USD pair is likely to rally to $233.314 and possibly $260.86.
Our bullish view will be invalidated if the pair fails to sustain above $185.87 or turns down from the 50-day SMA and plunges below $146.96. Therefore, the stops on the long positions can be maintained at $146.
LTC/USD
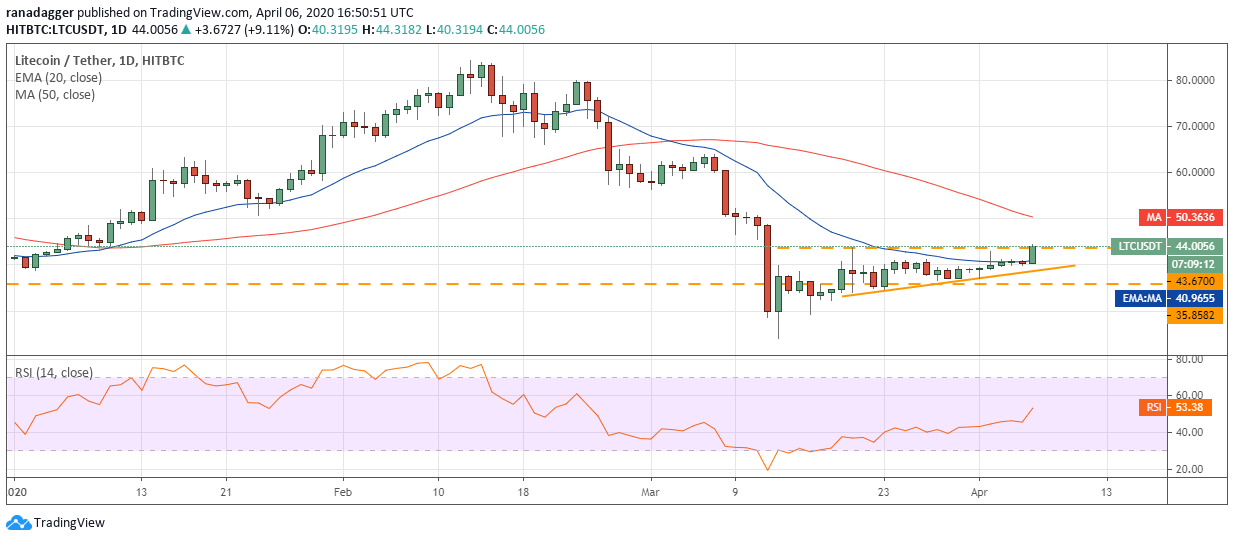
The bulls are attempting to sustain Litecoin (LTC) above the overhead resistance at $43.67. If successful, the altcoin is likely to start a new uptrend that can carry it to the 50-day SMA at $50 then $63.
LTC–USD daily chart. Source: Tradingview
Though there is a minor resistance at $52.2767, we expect the level to be crossed. Therefore, traders can initiate long positions as recommended by in an earlier analysis.
If the bulls fail to sustain the price above $43.67, the LTC/USD pair might extend its stay inside the range. A break below $35.8582 will turn the tide in favor of the bears.
EOS/USD
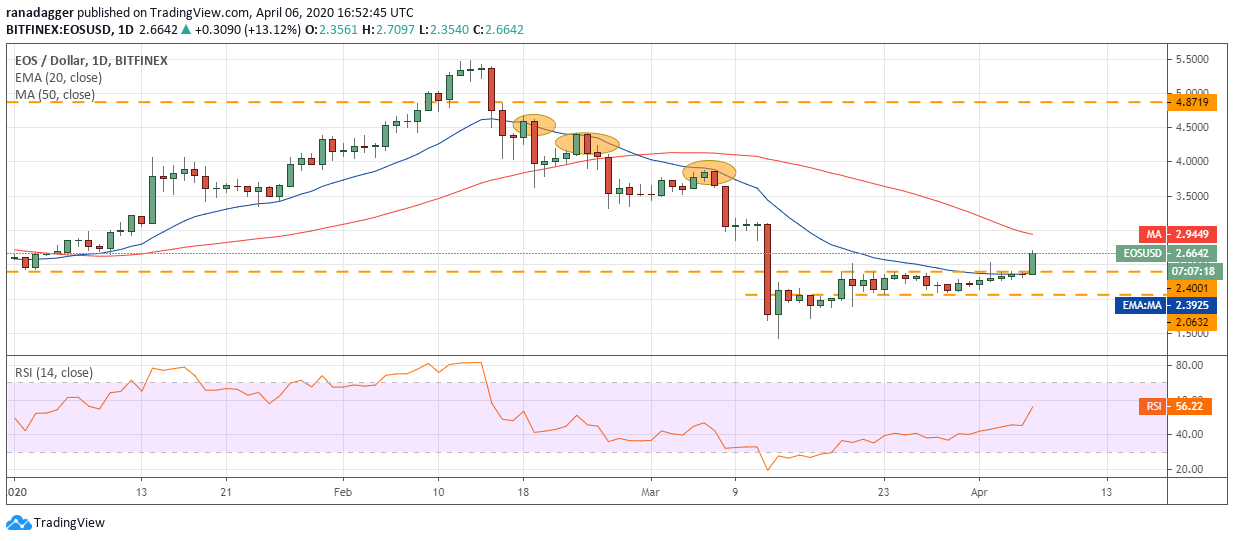
EOS closed (UTC time) above the 20-day EMA on April 4, which triggered our buy suggested in an earlier analysis. Nonetheless, the traders who could not initiate long positions on that day can even do so on any dips towards $2.50.
EOS–USD daily chart. Source: Tradingview
The first target is the zone between the 50-day SMA at $2.9423 and $3.1802. The bears are likely to offer stiff resistance in this zone, which might result in a consolidation or minor correction. Nonetheless, we expect the up move to continue and reach the next target of $3.86.
Our bullish view will be invalidated if the buyers fail to sustain the EOS/USD pair above $2.4001. In such a case, the pair can re-enter the $2.0632-$2.4001 zone. A break below $2.0632 will signal weakness. Therefore, the stops can be kept at $2.
BNB/USD
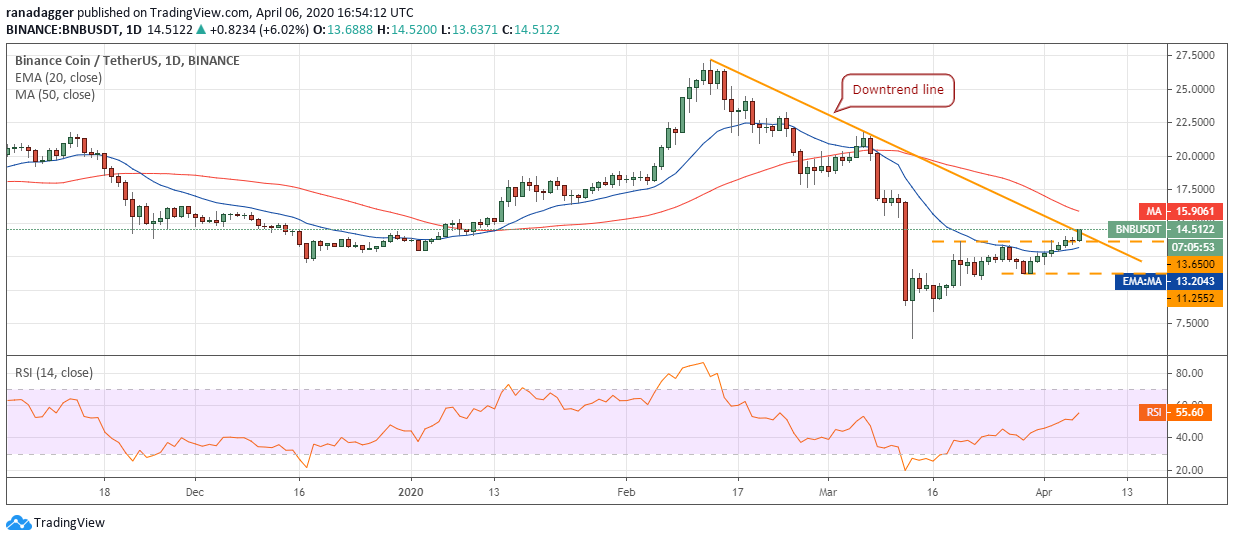
Binance Coin (BNB) has broken out of the overhead resistance at $13.65 and is currently attempting to scale above the downtrend line. If successful, it will signal a change in trend. Therefore, we retain the buy suggested in the previous analysis.
BNB–USD daily chart. Source: Tradingview
The 50-day SMA at $15.90 might act as a resistance but we expect it to be crossed. Above this level, a move to $17.50 and above it to $21.80 is likely.
Our bullish view will be invalidated if the BNB/USD pair turns down from the current levels and plummets below the support at $11.2552.
XTZ/USD
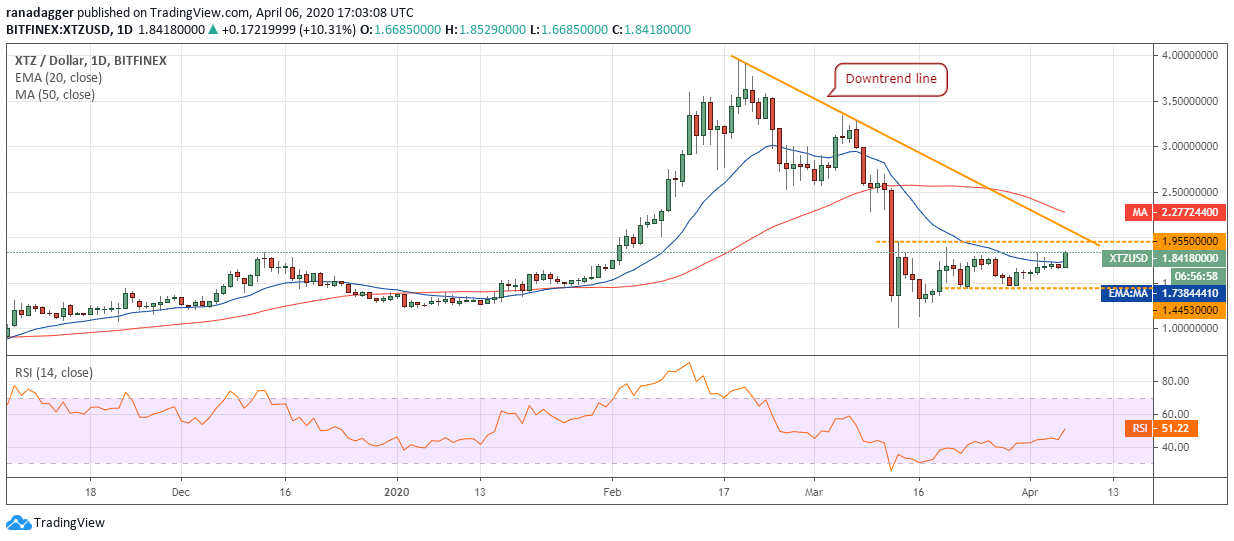
Tezos (XTZ) had been trading close to the 20-day EMA for the past four days. Though the bulls could not sustain the price above the 20-day EMA, they did not give up much ground, which indicates strength.
XTZ–USD daily chart. Source: Tradingview
The bulls have again pushed the price above the 20-day EMA at $1.74, which is likely to result in a rally to the horizontal overhead resistance of $1.955. The bears will again attempt to defend this level aggressively.
However, if the bulls can propel the XTZ/USD pair above $1.955 and the downtrend line, a new uptrend is likely. The flat 20-day EMA and the RSI just above the midpoint suggest that the sellers are losing their grip.
Traders can initiate long positions as suggested in an earlier analysis. The bullish view will be invalidated if the pair turns down from the current levels or $1.955 and plummets below $1.4453.
LEO/USD
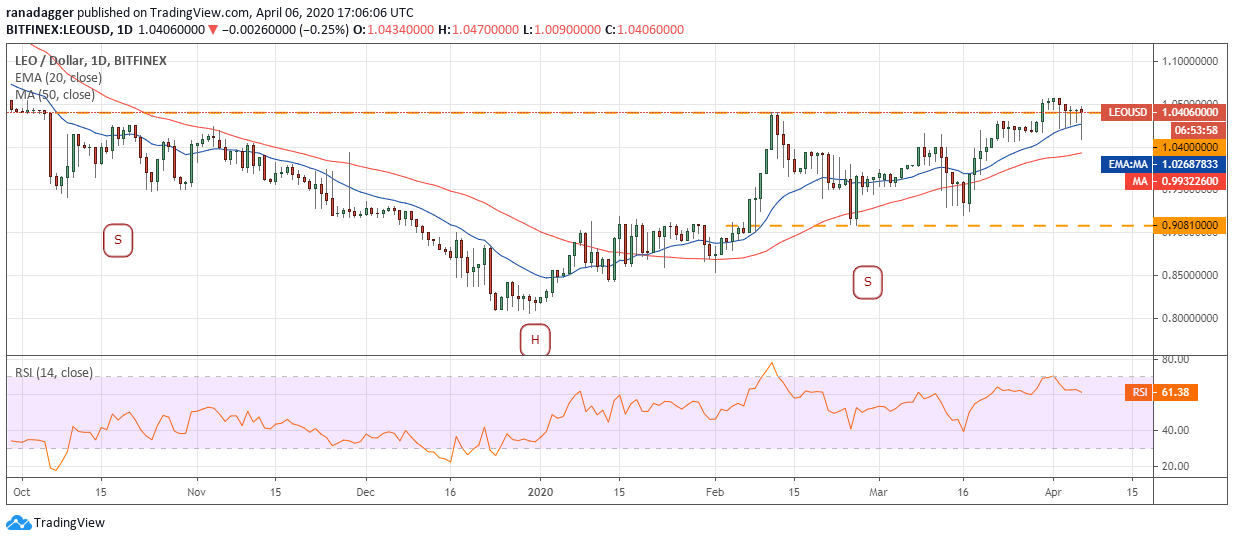
The bulls are struggling to keep Unus Sed Leo (LEO) above the overhead resistance of $1.04. This shows a lack of buyers at higher levels. The only positive is that the bulls have aggressively defended the 20-day EMA for the past few days.
LEO–USD daily chart. Source: Tradingview
If the bulls can push the price above $1.057, the LEO/USD pair is likely to commence its journey towards its target objective of $1.27488 and above it $1.36. The up sloping moving averages and the RSI in the positive territory suggest that bulls have the upper hand.
Our bullish view will be invalidated if the pair turns down from the current levels or $1.057 and plummets below $1.0061. Therefore, the traders can trail the stops on the long positions to $1.
The views and opinions expressed here are solely those of the author and do not necessarily reflect the views of Cointelegraph. Every investment and trading move involves risk. You should conduct your own research when making a decision.
Market data is provided by HitBTC exchange.

