The price of Bitcoin (BTC), the top-ranked cryptocurrency by market capitalization, has been ranging between $8,600 and $10,500 since the halving. During the two-months’ sideways action, the market started to heat up and altcoins entered the spotlight.
Additionally, traders and investors are constantly debating whether BTC price is still in bull or bear territory. Let’s take a closer look at the charts to where Bitcoin may be headed next.
Crypto market daily performance. Source: Coin360
Bitcoin has to hold support above the crucial level of $8,600
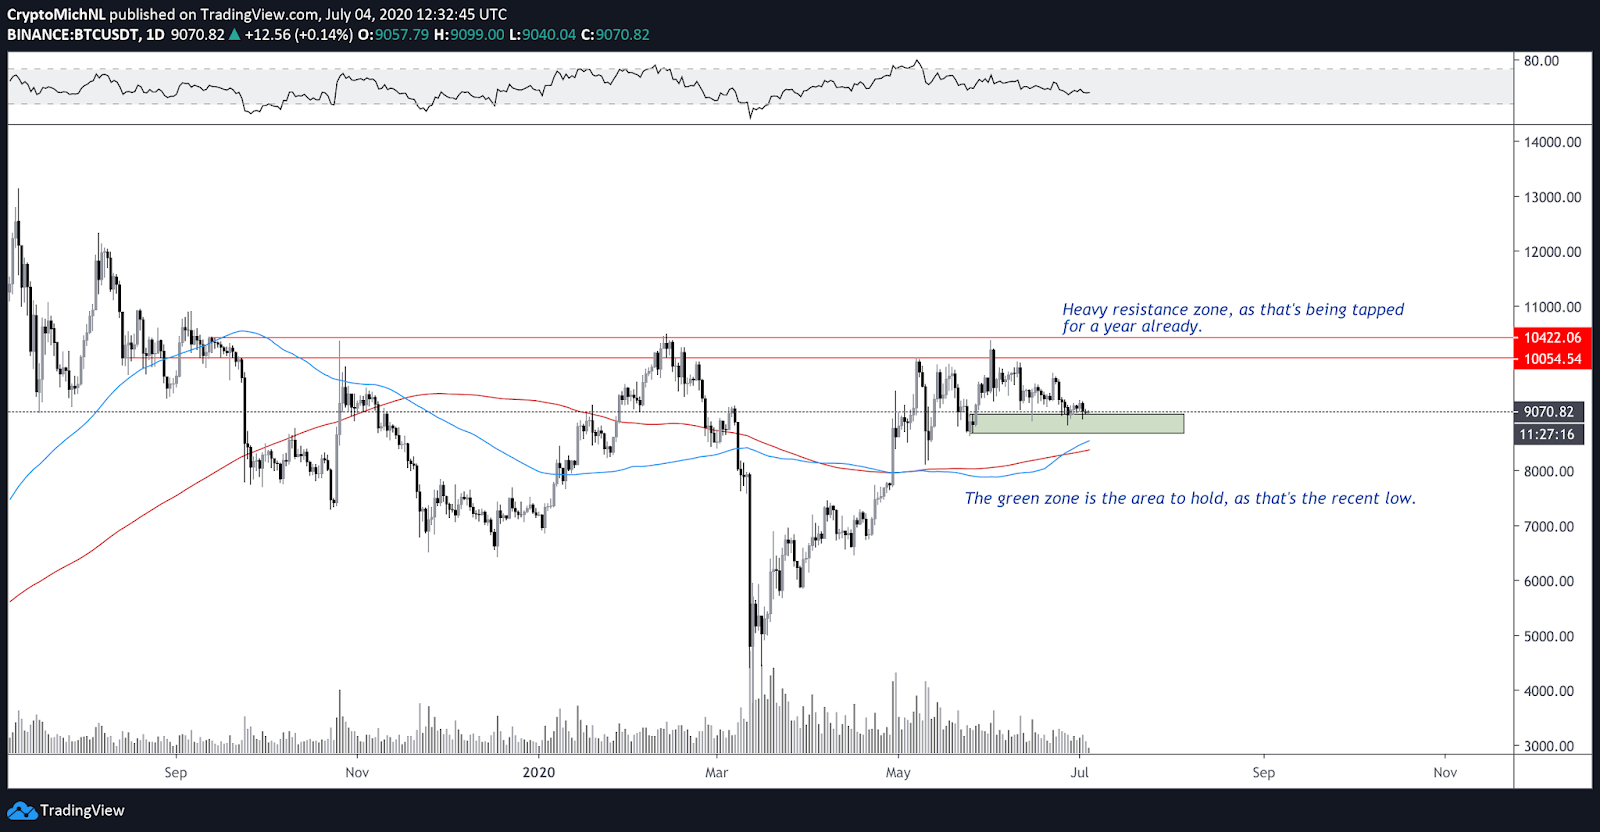
The price of Bitcoin has a critical level to sustain above at the $8,550-8,750 area.
BTC/USD 1-day chart. Source: TradingView
Bitcoin has been in a significant uptrend since the heavy crash in March. As an uptrend is classified through higher highs and higher lows, the recent low is found at the $8,550-8,750 area.
This is a significant area because traders use these pivots for the placement of stop/loss levels. But since the price of Bitcoin has been slowly retracing and consolidating, the focus should be on the volume.
During the consolidation period, the volume steadily decreased. This is an indication that we’re not in the “move,” which would mean a new trend. This move would be confirmed by a heavy breakout above $10,500 or a heavy breakdown below $8,500.
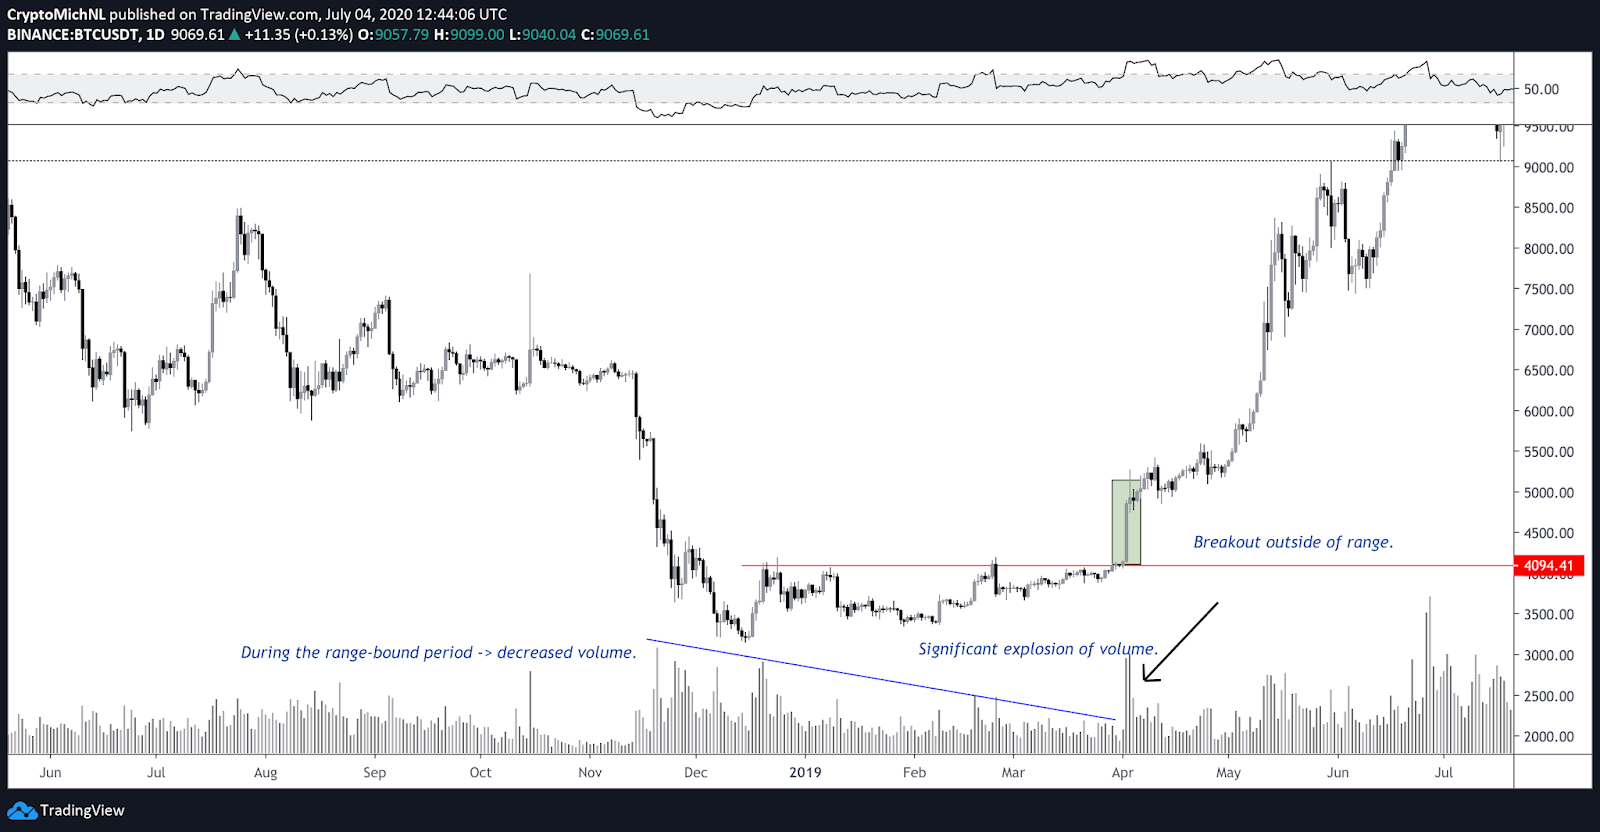
An example is seen in the consolidation period around $3,500-4,000 eighteen months ago.
A big move is on the horizon
In the first quarter of 2019, the price of Bitcoin moved inside a narrow range.
BTC/USD 1-day chart. Source: TradingView
This is significant because it shows what usually happens during a lengthy sideways period and why the current stage is also classified as one.
During the range-bound period of 2019, the volume drained away over time. The actual climax of the volume came with the breakout, which meant that breakout traders hit their limit buys and shorters hit their stop/loss.
This chain reaction triggered a sudden $1,000 candle. As the price has been hovering in the range for months, the breakout is usually a significant and explosive one. The longer something ranges in a certain accumulation period, the bigger the move once it breaks out.
This exact example can be seen with many altcoins as some of them have been hovering in an accumulation range. One such example is Zilliqa (ZIL), which broke out of the range and surged for 1,000% since.
Crucial levels on smaller timeframes for Bitcoin
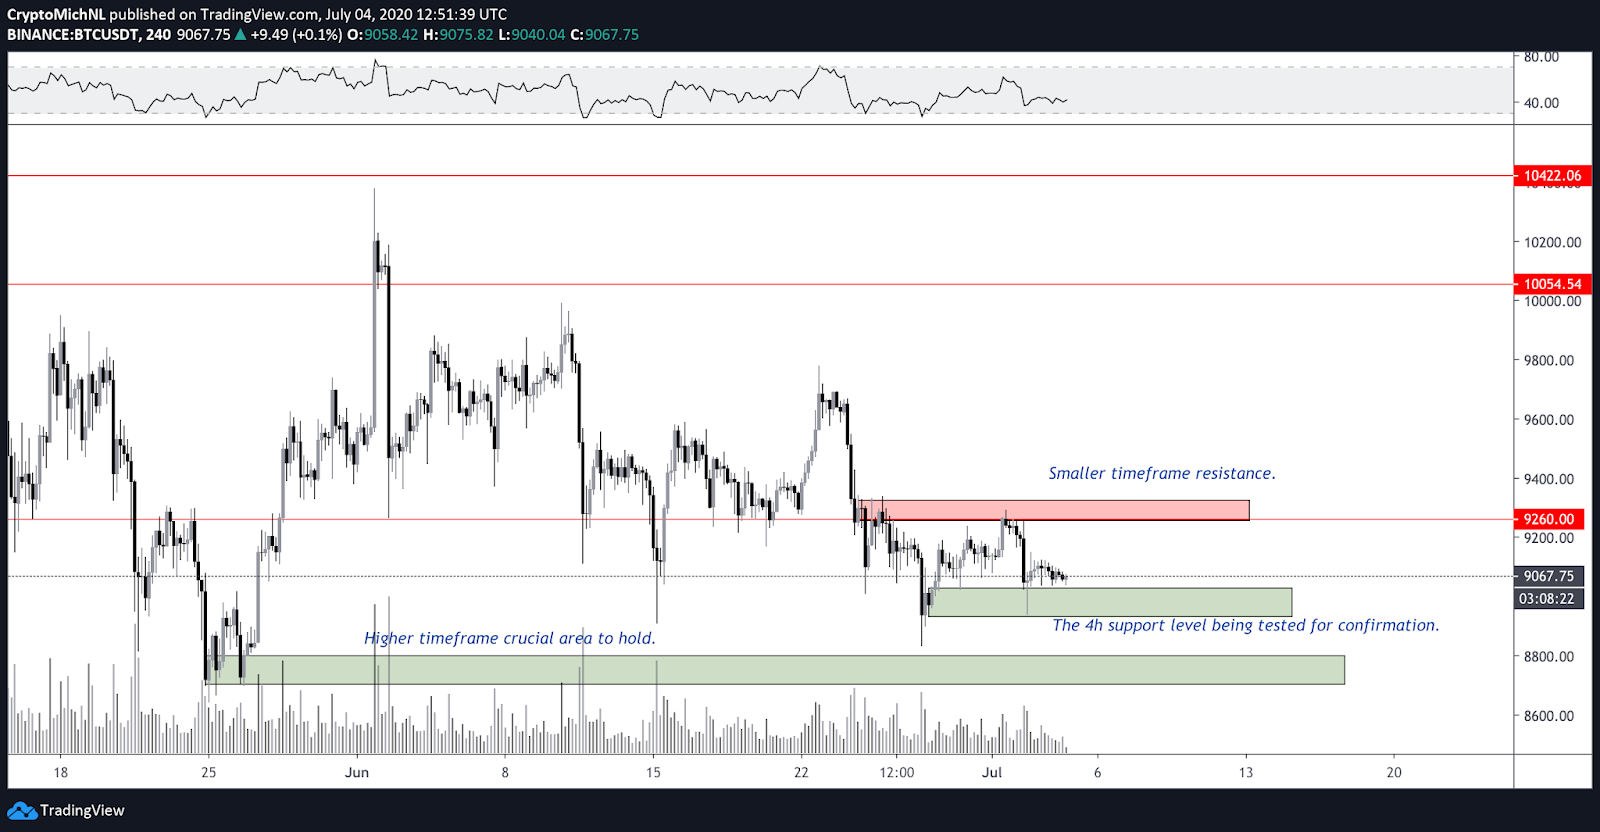
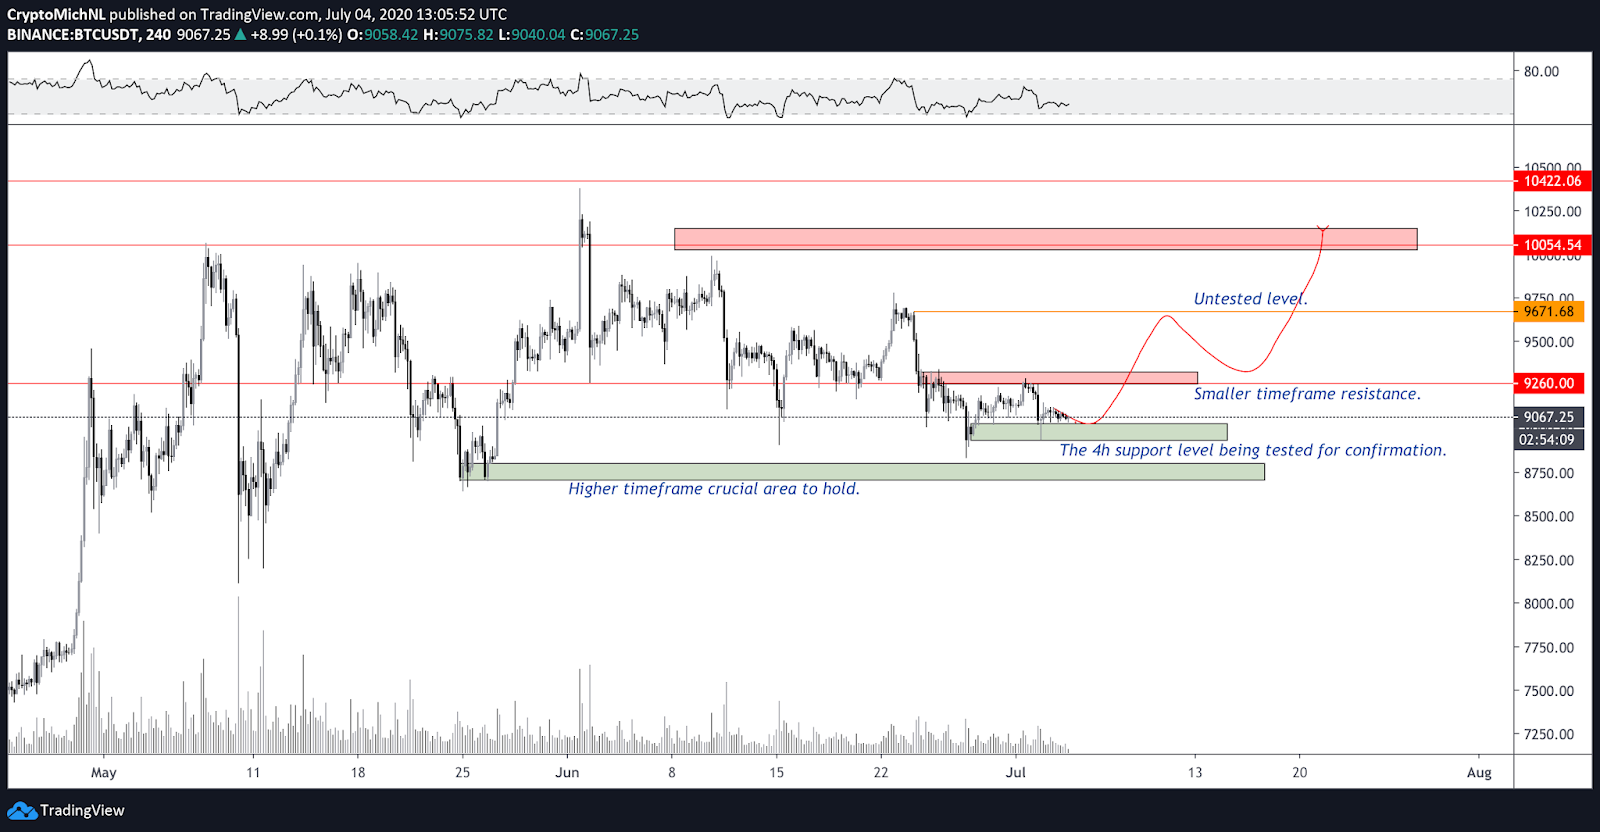
The crucial levels on smaller timeframes are essentially the support between $8,800-9,000 and the resistance at $9,300. The latter is more important as a breakthrough of the $9,300 level would signal further upward continuation.
BTC/USD 4-hour chart. Source: TradingView
The 4-hour chart is showing a clear range-bound structure. Support is found between $8,900-9,000, which must hold for the bulls. As long as that support remains support, a retest of the resistance zone is on the table.
Generally, the more often a level gets tested, the weaker it becomes. Therefore, a renewed test of resistance at the $9,300 level could lead to a significant breakout as it would place Bitcoin back inside the previous range.
In other words, the chances of further downside get slimmer if $9,300 is reclaimed.
Total market cap holding support above 100-day and 200-day MA
Total market capitalization cryptocurrency 1-day chart. Source: TradingView
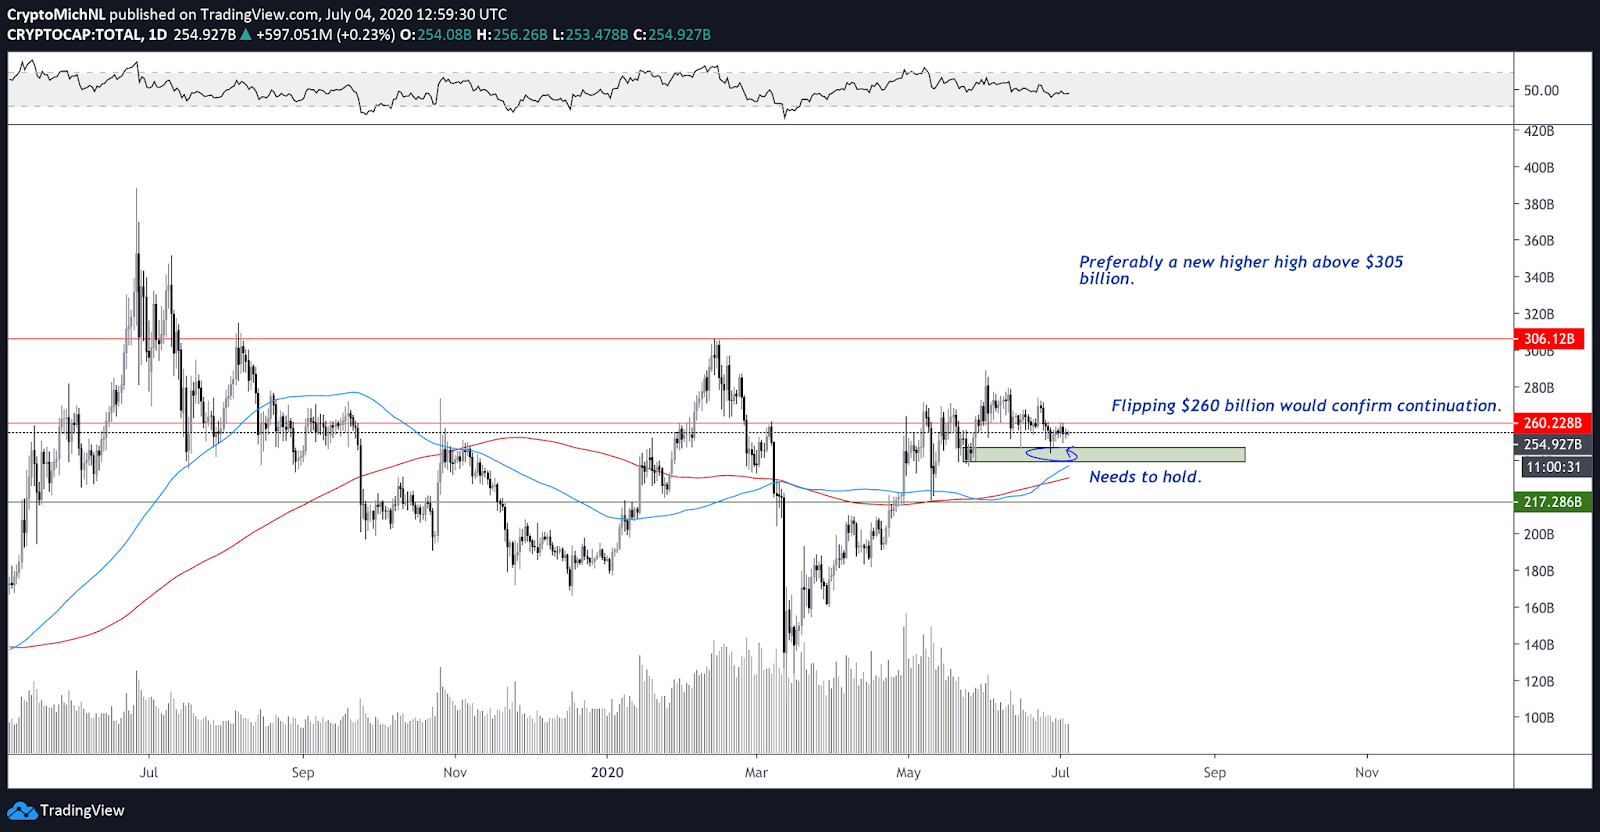
The total market capitalization of the cryptocurrency market is holding the previous low as support as well.
More significantly, the total cryptocurrency market cap is holding above the 100-day and 200-day Moving Averages (MA). As long as these hold, the market capitalization is in bull territory.
This is because this is a significant bull/bear momentum indicator. The 100-day and 200-Day MAs have been serving as support throughout the entire previous cryptocurrency market cycle.
With these levels likely holding as support, a breakout above $260 billion becomes increasingly likely. Reclaiming the $260 billion level would also add fuel for further momentum toward new highs.
The bullish scenario for Bitcoin
BTC/USD 4-hour bullish scenario chart. Source: TradingView
The bullish scenario has a few crucial points. First of all, the support at $8,900-9,000 has to hold. If this support is lost, BTC/USD will likely drop below $8,550-8,750 into bearish territory.
Second, the key resistance at $9,300 has to break for a potential rally toward $9,650. Since this level is untested, it would be the first pivot point for more upside. This previous resistance of $9,300 has to flip for support for a move higher.
However, as long as the price of Bitcoin remains below $10,500, it’s expected that the volume of the move will be small. A big breakout would occur if the resistance zone of $10,000-10,500 is finally conquered as many triggers would be hit.
It wouldn’t be a surprise to see a quick rise within a few hours to the next major resistance zone at $11,600.
The bearish scenario for Bitcoin
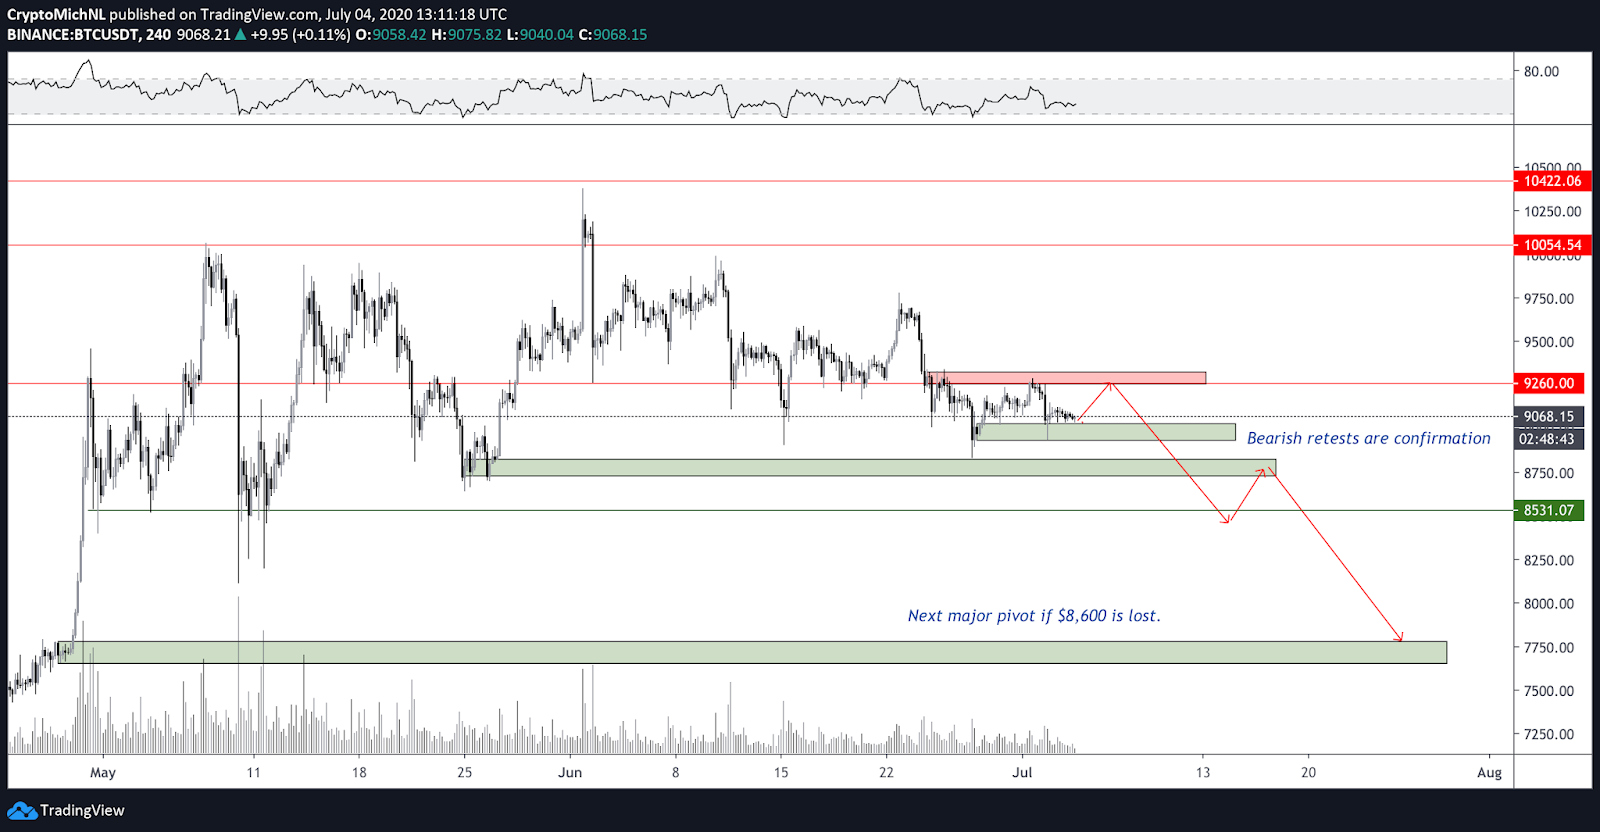
BTC/USD 4-hour bearish scenario chart. Source: TradingView
The bearish scenario is also heavily dependent on the $9,300 level. If that level rejects again, a retest of support at $8,800-8,900 should be expected and the weaker this support will become, increasing the chances for more downside.
With $9,300 holding as resistance, a retest of $8,800-8,900 would likely result in another drop. Going below the $8,600 level could also see a high-volume drop because this means that the range of the past two months would be lost.
If the price of Bitcoin drops below $8,600, I’m expecting a fast drop towards $7,400-7,700 without many opportunities for shorts. Holding the current support and the 1-day support levels would mean that the market is still in great shape.
The views and opinions expressed here are solely those of the author and do not necessarily reflect the views of Cointelegraph. Every investment and trading move involves risk. You should conduct your own research when making a decision.


