Quick take:
- June was a relatively stable month for Bitcoin and July looks set to follow a similar path.
- The lack of volatility by Bitcoin is forming a Bollinger squeeze that could be followed by a major move in either direction.
- At the time of writing this, there is a 50/50 chance it could go either way.
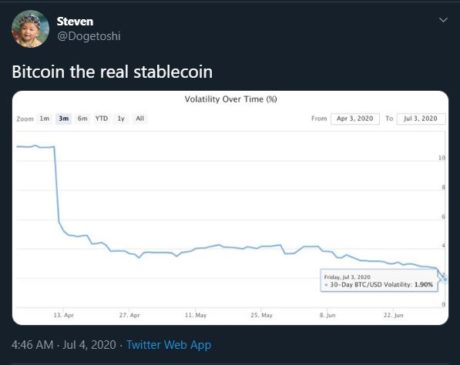
The first weekend of the month of July is almost coming to an end and with it, the weekly closing candle for Bitcoin (BTC). From the beginning of June, Bitcoin has had relatively low volatility. This is best exemplified by the tight trading range witnessed from around the 25th of June till now.
During the latter mentioned time frame, Bitcoin has traded between $9,300 and $8,800. At the time of writing this, BTC is once again stable at the $9,000 support zone. This fact has led some crypto-traders to declare that Bitcoin has become the real stablecoin.
Bitcoin is Printing a Bollinger Squeeze and a Major Move is Imminent
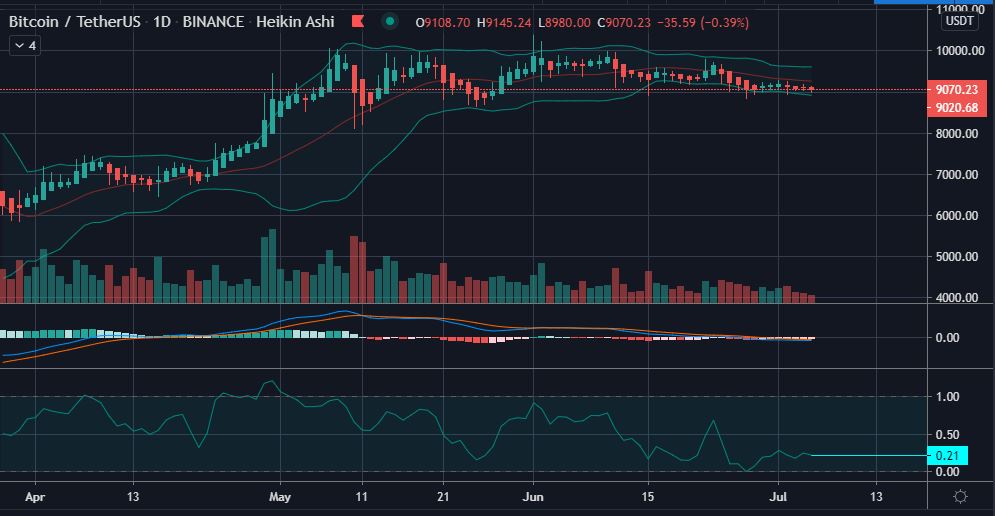
This tight trading range by Bitcoin is creating what is known as a Bollinger Band squeeze. According to the inventor of the trading indicator, John Bollinger, such periods of low volatility are often followed by periods of high volatility. He explains:
Therefore, a volatility contraction or narrowing of the bands can foreshadow a significant advance or decline. Once the squeeze play is on, a subsequent band break signals the start of a new move. A new advance starts with a squeeze and subsequent break above the upper band. A new decline starts with a squeeze and subsequent break below the lower band.
From the daily BTC/USDT chart, it can be seen that the price of Bitcoin is closer to the lower band and the Bollinger Bandwidth indicator is low at 0.21. This indicator measures the percentage difference between the upper band and the lower band. It provides a better visual of the Bollinger squeeze evident with Bitcoin.
What Next for Bitcoin?
In conclusion, Bitcoin is in a tight trading range between $9,300 and $8,800. This is clearly a no-trade zone as demonstrated by the formation of a Bollinger squeeze. Additionally, this squeeze is usually the precursor to a major move in either direction.
Therefore, it could go either way for Bitcoin right now. A prudent move would be waiting for a break in either direction. A push above $9,300 could point to another drive towards $10,000 whereas a break below $8,800 could point to lower levels of $8,500 around the 200-day moving average.
As with all analyses of Bitcoin, traders and investors are advised to use risk management techniques such as stop losses and low leverage during uncertain times. Taking a ‘wait and see’ approach might also be a good idea during times of uncertainity.
Disclaimer: This article is not meant to give financial advice. Any additional opinion herein is purely the author’s and does not represent the opinion of EWN or any of its other writers. Please carry out your own research before investing in any of the numerous cryptocurrencies available. Thank you.


