There is a clear divergence between fundamentals—Tron Accelerator program, transactions spike and on-chain development and TRX/USD prices. Regardless, dropping prices shouldn’t be defining metrics because fundamentals often lead prices. As such, we expect TRX to rebound back to early this week’s valuation more so if today end up bullish.
Latest Tron News
A project is only as good as the community that backs it. That is the spirit of decentralization and an embodiment of blockchain mantra. Well, Tron as we all know live by that. Its leader Justin sun and the Tron Foundation do complement each other updating their supporters whenever there is a partnership or whenever the platform registers new milestone.
Read: Reddit Co-founder: Bear Market is Good for Crypto Innovation
Just recently, social media was awash with news that the smart contracting and dApp building platform number of transactions had surpassed that of Ethereum—1.36 million—which is almost double that which Ethereum—a rival platform print on a normal day. This is indicative of the path Justin sun and Tron are taking.
Scatter now fully supports Tron dapps.#Tron #TRX #EOS #EOSIO #ETH #Ethereum #Blockchain #Dappshttps://t.co/ReR8Rk5fMd
— Scatter (@Get_Scatter) November 4, 2018
Furthermore, since the native currency TRX now has the support of Scatter meaning supporters can easily import their TRX wallets without a sweat while receiving the same support from Huobi multi-currency wallet, traders and new comers have several free and trusted avenues for storing and managing their stash.
Thanks for the support to #TRON. #TRX $TRX https://t.co/U9FO2gwp19
— Justin Sun (@justinsuntron) November 20, 2018
On the development front, Tron developers are doing everything they can to improve user experience. After review, the developer document API Reference Page was upgraded and new transaction guide added. At the same time, the $1 million Tron Accelerator Program seeks to empower developers and accelerate innovation—via dApp creation–within the platform.
We are empowering developers by releasing #TRONAccelerator, a $1 million USD program aiming to foster innovation within the #blockchain industry. Build your DApp on #TRON, shape the future! $TRX https://t.co/TTZsGoJ6au
— TRON Foundation (@Tronfoundation) November 16, 2018
TRX/USD Price Analysis
Weekly Chart
On a weekly basis, TRX/USD is down 34 percent in the last week and the meltdown translated to a bear breakdown pattern in the weekly chart. As visible from the chart, prices are down 80 percent from 2018 highs indicating how relentless sellers have been.
Notwithstanding, as prices printing below the lower limit of our support at 1.5 cents, we expect further declines in coming weeks. Though losses might be limited thanks to Fibonacci retracement reversal rules, it all depends on if buyers would drive prices above 1.5 cents, our immediate resistance line.
If they do the TRX/USD bulls might propel prices back to 2.5 cents and later 3 cents as laid out in our last TRX/USD price analysis. On the flip side, if bears step up and prices drop below 1 cents then sellers would be in charge and traders would better unload TRX on every high in lower time frames.
Daily Chart
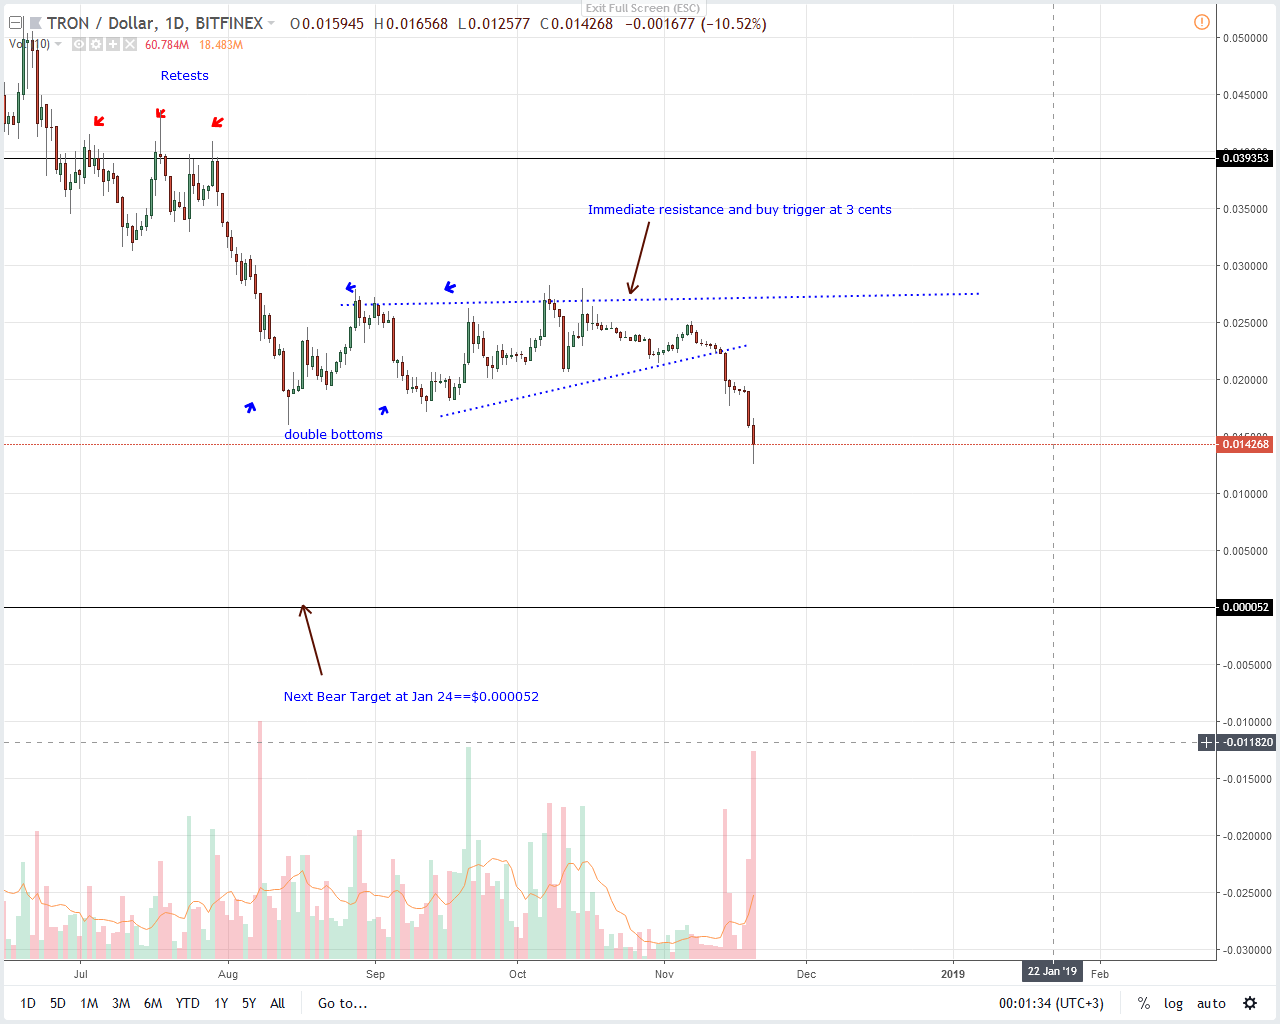
What we have in the daily chart could be a hint of a market bottom. Notice that there is a surge in trading volume—twice that of Nov 19 at 60 million versus 30 million and yet TRX/USD trade ranges are tight.
On top of the relatively tight trade range, there is a visible long lower wick pointing to demand in lower time frames. Roll this up and chances are we have an ecstatic sell off marking the bottoms of a potential rally.
As a result, we suggest traders to cease from selling their TRX and if today print higher then bulls could end up driving this coin back to 2 cents. If not and today print lower then we shall trade according to our previous TRX/USD trade plans with first target at Jan 24 lows.
All Charts Courtesy of Trading View
Disclaimer: Views and opinions expressed are those of the author and aren’t investment advice. Trading of any form involves risk and so do your due diligence before making a trading decision.


