CCN is expanding. Are you our next full-time journalist from the West Coast USA? Send us your CV and examples here.
The bitcoin price on Wednesday saw the arrival of bulls as it surged 15 percent in an impressive rebound action.
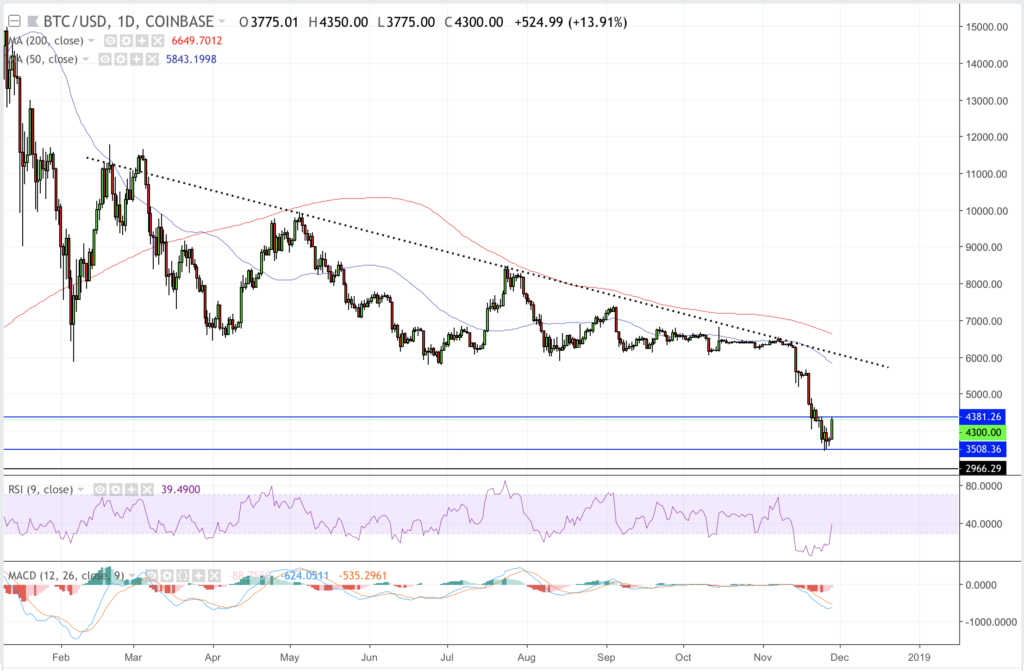
The BTC/USD index opened at 3776-fiat while continuing the upside action of the previous day. It kept forming higher highs, eventually setting its daily peak at 4350-fiat as the US trading session came into play. At the time of writing, the pair is trading at 4300-fiat, up 23.6 percent from its yearly low at 3451-fiat.

Technically on the 1D Chart, the Relative Strength Index is near 38, which is still a bear area. The momentum indicator, though, expects to notch further above — towards 50 — to would neutralize the bias in near-term. The MACD is still inside a negative territory, and it would take a robust extended upside momentum for a potential bullish crossover.
Bearish bias still clouds the bitcoin market, and it is expected to stay strong unless BTC/USD rolls above the large descending trendline depicted in a dotted stroke. The intraday bullish action could be nothing but a bear flag forming before the price reverses down once again and retests 3500-fiat as support. The price has in no way bottomed unless 3500-fiat proves its credibility consecutively like 6000-fiat did the entire year — until recently anyway.
Meanwhile, the US dollar has weakened and dropped into negative territory after Federal Reserve Chairman Jerome Powell said US interest rates are “just below” the neutral rate. Almost all the dollar rivals, including GBP and EUR, recorded intraday gains. Bitcoin’s uptrend arrives virtually around the same time.
BTC/USD Intraday Analysis

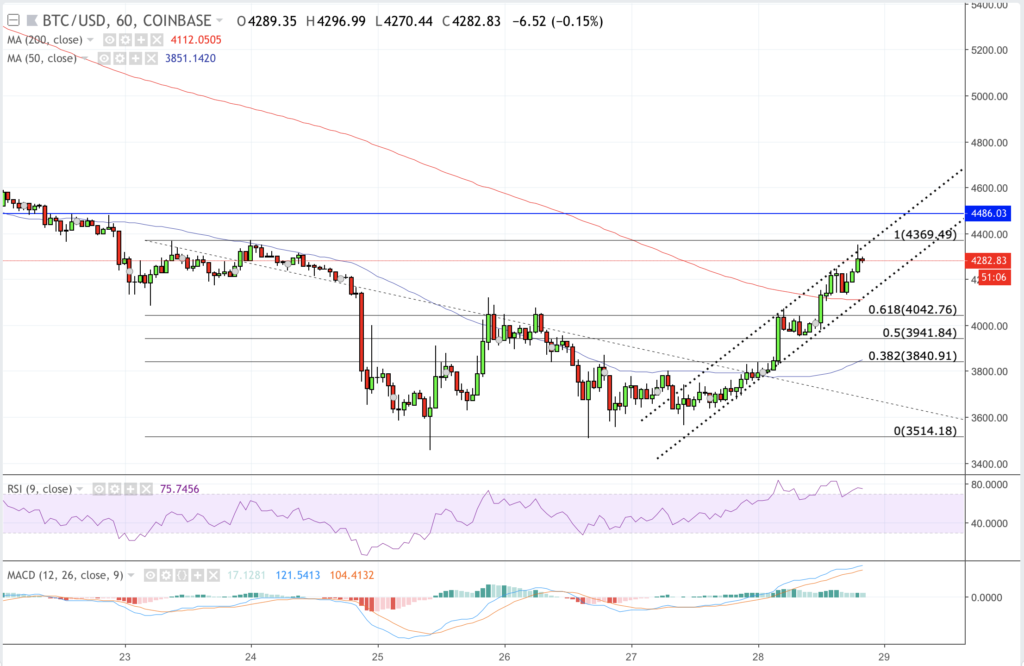
The BTC/USD rate is comfortably trending upwards in a rising parallel channel — though too narrow. As for our intraday strategy, we are putting our bets on 4369-fiat to hold the upside as interim resistance while its 50-period moving average near 3851-fiat could offer decent interim support.
That said, we are first getting ready for a breakout action. A move above 4369-fiat would have us prepare a long position towards 4486-fiat. As we do, we will maintain a stop loss order just 3-4 dollars below the original entry point, so as to minimize our losses if bears attack the ongoing rally.
The inverse head and shoulder pattern is making a strong case for 4486-fiat as a potential neckline. An extended breakout action would not come immediately there if it comes anyway.
The RSI indicator on the hourly chart indicates BTC/USD has overstayed inside the overbought area so it could reverse soon. If it does happen, we will open a short position towards the 50-period SMA while maintaining a stop loss order just 4-5 dollars above the entry position.
We will switch to our breakdown strategy if BTC/USD breaks below the said SMA level. Then, our downside target would shift towards 4042-fiat, with a stop loss just 3 dollars above the SMA support minimizing risks.
Trade safely!
Featured Image from Shutterstock. Charts from TradingView.
Get Exclusive Crypto Analysis by Professional Traders and Investors on Hacked.com. Sign up now and get the first month for free. Click here.


