Bitcoin attempted to bounce back this Thursday following a string of sessions in red earlier this week.
The benchmark cryptocurrency was up 0.25 percent at $11,788 as of 10:03 GMT. But its modest upside outlook failed to impress at least one trader.
The pseudonymous crypto-analyst, having around 60,000 followers on Twitter alone, noted that the bounce from $11,569-level showed “weak reaction at support.”
He pitted the pullback level against the 14-day bull run that preceded it, adding that its inability to attract enough bulls raised the possibilities of an extended downward move.
“This is a sh*t reaction to daily support for Bitcoin and majors. Retraced 14-day breakout (and some). The weak reaction at support. Not what you want to see if you’re a bull, like me. Will be saving ammo for lower if it goes there, will be happy to pay for confirmation if not.” – the analyst tweeted.
Bitcoin price chart on TradingView.com shows BTCUSD in a modest pullback to the upside.
A $350K Bitcoin Ahead
The analogy appeared in contrast with most of the other prominent traders in the cryptocurrency market.
Many of them treated Bitcoin’s latest pullback from $12,000 as a technical correction that typically follows a bullish move. Some even stated that the cryptocurrency is still en route to logging a new record high by the end of this year.
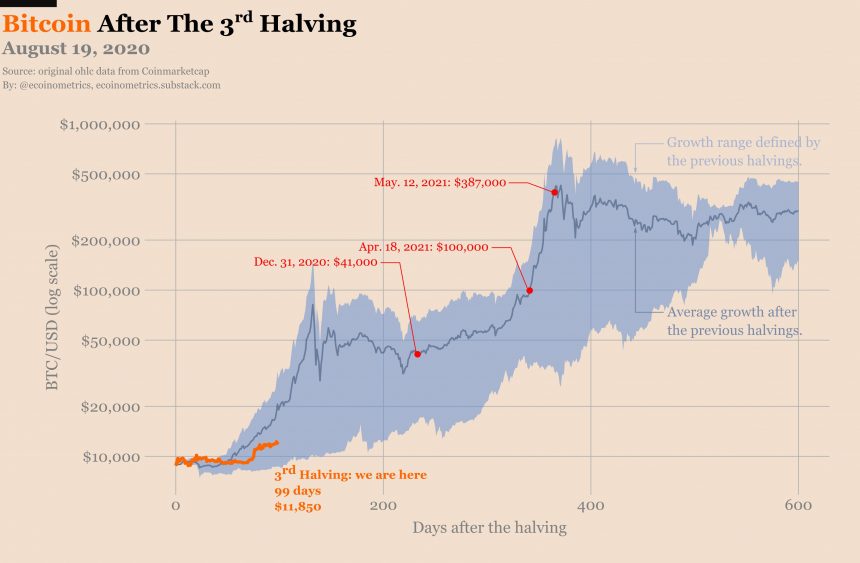
Vijay Boyapati, the celebrated author of the study, titled “The Bullish Case for Bitcoin,” ignored the cryptocurrency’s recent correction. The analyst noted that the BTC/USD is eyeing a bull run towards $325,000 by next year following its third “halving” on May 11, 2020.
Halving refers to a systematic reduction in Bitcoin’s supply by half every four years. History shows that the previous two events led to the cryptocurrency price higher by as little as 300 percent.
Bitcoin halvings and their impact on the price in the US dollar market. Source: Ecoinometrics
Shorting Towards $10,250
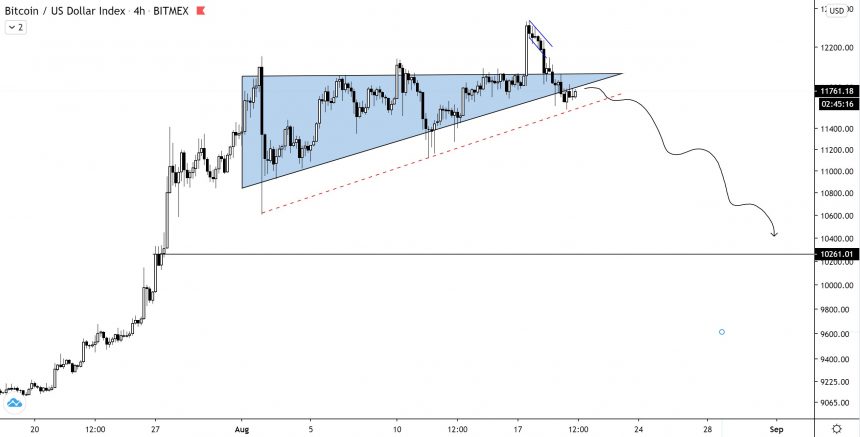
But the short-term technical outlook appeared more alarming to traders. Teddy Cleps, a crypto-focused market analyst, envisioned Bitcoin in a freefall towards $10,250. He cited an Ascending Triangle pattern for his bearish take.
Bitcoin is breaking below an ascending triangle pattern. Source: TradingView.com
Earlier before, the BTCUSD exchange rate logged a fake breakout move above the said pattern. And now, it is was on its way of registering a breakdown. While typically bullish, Ascending Channels can also behave as reversal patterns on the move below their lower trendline.
Conversely, if the Bitcoin price manages to hold above its so-called weak support of $11,569, then the cryptocurrency could eye a retest of the $12,000-level.


