The bitcoin price kicked off the week on a negative note after correcting 2 percent to the downside.
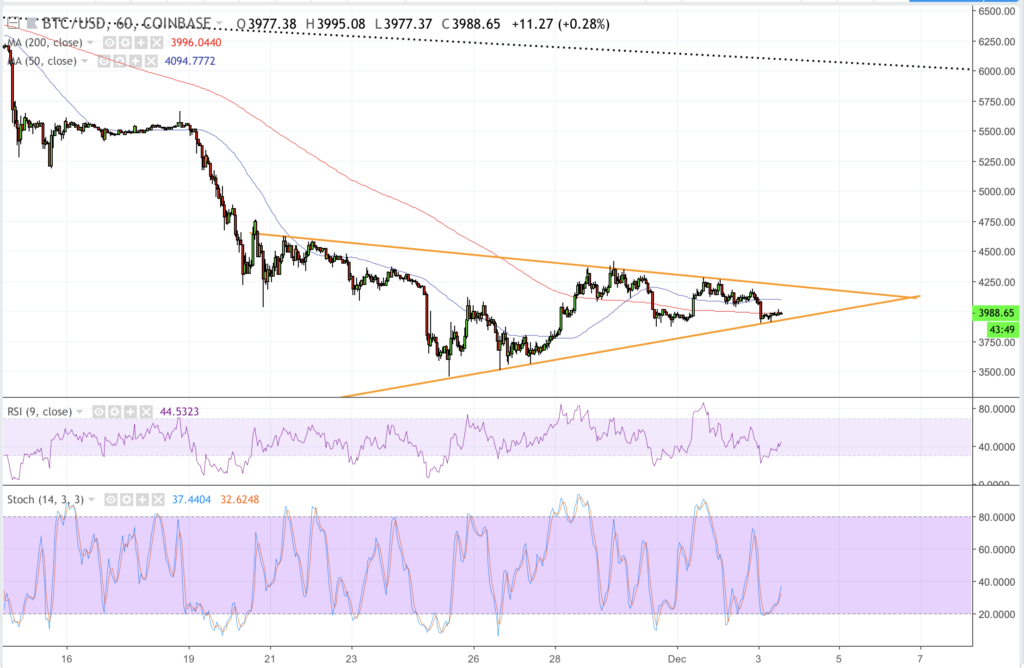
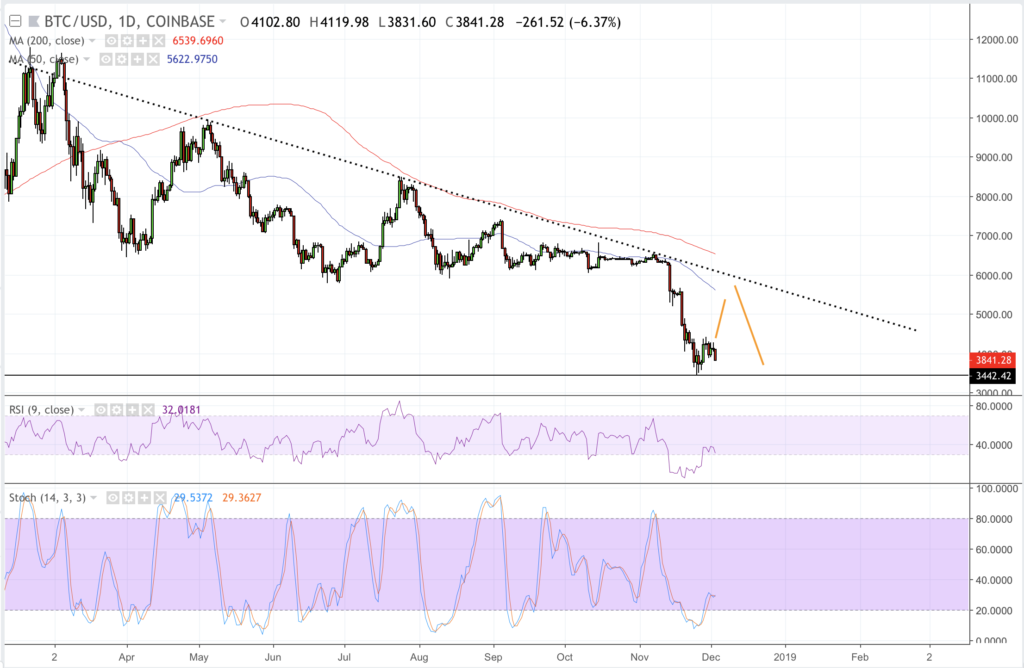
The BTC/USD rate found itself unable to breach above the neckline level discussed in our previous analysis. The falling trendlines look stronger than ever in other patterns as well. The symmetrical triangle formation, for instance, on the hourly chart also presents its upper trendline as a strong resistance level to the recent bullish attempts. Bitcoin is forming lower highs and higher lows to consolidate inside the same triangle. As of now, we are testing the support area of the triangle pattern.

The BTC/USD rate is now bouncing back from a newfound support level at 3910-fiat and is due to retest the triangle resistance. If buyers are strong enough, they should be able to push the pair above the wall, creating a scenario of a breakout formation. In that case, the next upside target is located at 4413-fiat — still inside a fake breakout zone — which should create a decent long opportunity for bulls. At the same tip, placing a stop loss $10 below the local swing low would define the risk management strategy.
Meanwhile, as BTC/USD tests the triangle support, there is a strong likelihood of a breakdown action as well. An extended selling action brings 3650-fiat in view as the immediate downside target. Traders looking to enter short towards the said bear level should maintain a stop loss target $10 above the local swing high. It would minimize the losses if the price action reverses direction.
BTC/USD Technical Indicators

The BTC/USD pair is trending below its 50-period and 100-period simple moving averages. The RSI momentum indicator is consolidating inside the selling area, just above 30. Meanwhile, the Stochastic Oscillator is also on its way up, signaling a potential break towards 52 — a neutral zone.
The long-term trend, thus, is bearish. The next upside swing depends on the ability of 3442-fiat to hold the downside momentum. A full-fledged bullish bias cannot be confirmed unless the BTC/USD pair jumps above the 50-period SMA on the daily chart.
Trade safely!
Featured Image from Shutterstock. Charts from TradingView.
Get Exclusive Crypto Analysis by Professional Traders and Investors on Hacked.com. Sign up now and get the first month for free. Click here.


