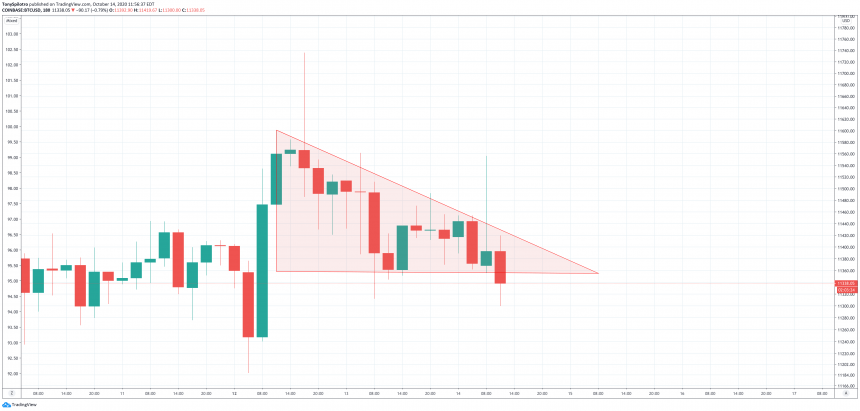
Bitcoin price is experiencing a surge of intraday volatility, rocketing $150 in minutes then collapsing more than $250 just moments later.
Here’s what is going on in the top-ranked cryptocurrency and what to watch for as price action to develops.
Triangle False Breakout Rejects Bulls Back Below Resistance At $11,500
Bitcoin’s notorious volatility is back after a short-lived phase of tranquility. Explosive price action this week following a bullish breakout of a downtrend line on the heels of Square news sent the cryptocurrency well above $11,000 and kept climbing.
Bulls Rejected After False Descending Triangle Breakout | Source: BTCUSD on TradingView.com
Resistance above $11,750 proved too strong to penetrate and the leading crypto asset by market cap fell lower, where a triangle began to form.
Related Reading | Analyst: Sidelined Capital Enough To Push Bitcoin To $1 Trillion Market Cap
This morning, a false breakout of the upper trendline baited bulls into a fierce rejection, resulting in a sharp drop of $250 lower.
Bearish Bitcoin Chart Pattern Points To Retest Of $11,000, Will It Hold?
Zooming out further, shows the descending triangle breaking down with a potential target of $11,000.
Descending Triangle Bearish Breakdown in Progress | Source: BTCUSD on TradingView.com
Bears have a chance of pushing Bitcoin back down toward $10,000 if bulls cannot defend the key support level. However, if the crypto asset can reclaim $12,000, chances of a higher high in 2020 will become a lot more likely.
Related Reading | Dwindling Bitcoin Volatility Could Lead To Decisive Move
The current price level is a pivotal range where whichever way breaks, could set the trend for the rest of the year and into 2021.
Featured image from Deposit Photos, Charts from TradingView.com


