Key Highlights:
- Traders should remain flat;
- bulls may take over the Bitcoin market in case there is a breakout above $3,726;
- break out is imminent.
BTC/USD Long-term Trend: Ranging
Resistance levels: $3,726, $4,426, $5,070
Support levels: $3,094, $2,261, $1,500
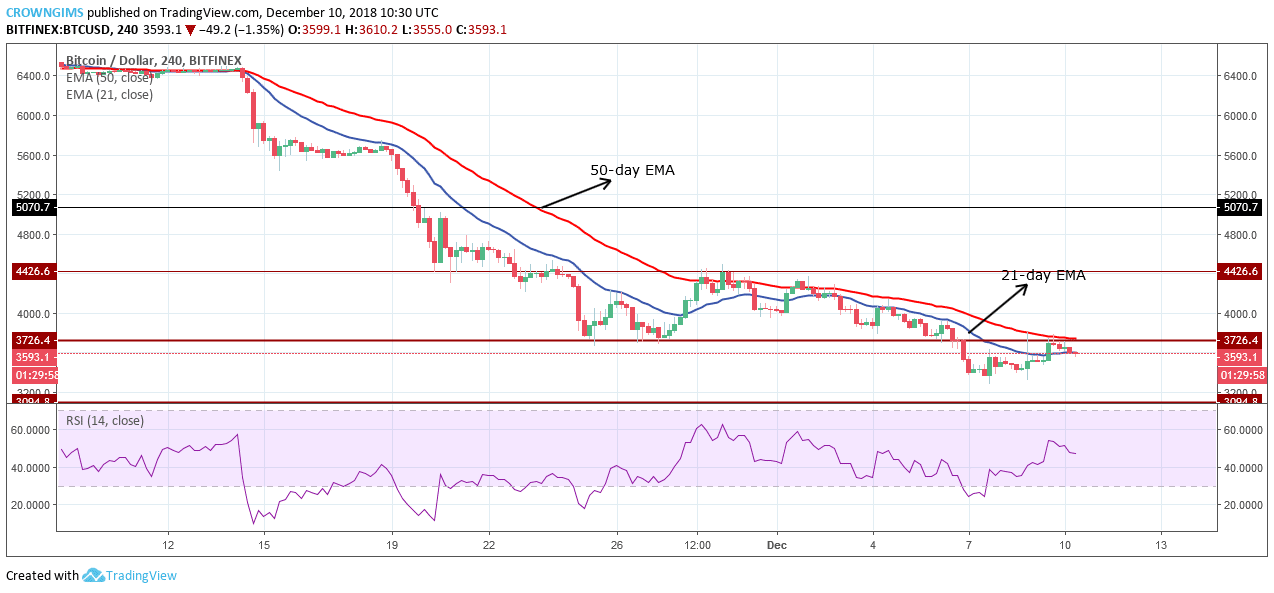
BTC/USD is ranging on the long-term outlook; the cryptocurrency started sideways movement on November 24 within the range of $4,426 and $3,726 price level and it continues till December 5. The bears gained pressure and pushed the coin down to break the former support level of $3,726, then started consolidating again. The Bitcoin price is currently exposed to support level of $3,094.
Although BTC price remains below the 21-day EMA and 50-day EMA as a sign of a bearish trend, the Relative strength index period 14 is on the 30 levels parallel/flat to the level without direction which indicates that consolidation is ongoing.
Should there be a clear penetration above the resistance level of $3,726 then the bullish rally will be anticipated towards the supply level of $4,426 – $5,070. A breakout below the support level of $3,094 will further decline in Bitcoin price towards $2,261 – $1,500 price level. Traders can remain flat as long the consolidation continues.
BTC/USD Medium-term Trend: Ranging
BTC/USD is ranging on 4-Hour chart. The coin has been range bound between the resistance level of $3,726 and the support level of $3,094 since December 6, shortly after the support level of $3,726 is broken downside.
The Bitcoin price is currently in between the 21-day EMA and 50-day EMA and the two EMAs were flat which indicates that consolidation is ongoing on the 4-Hour chart on the BTC market. However, the Relative Strength Index is above 40 levels bending to the south which connotes sell signal.


