Bitcoin (BTC) is still struggling to find the bottom of a bear market on the anniversary of its $20,000 all-time record price high.
At press time, the world’s largest cryptocurrency by market capitalization was trading at $3,230 on Bitstamp – down 83.5 percent from the record high of $20,000 reached on Dec. 17, 2017.
BTC is also down 76 percent on a year-to-date basis (from its opening price of $13,880 on Jan. 1) and is on track to end its three-year winning streak.
The picture, however, was remarkably different in the fourth quarter of the last year. The cryptocurrency picked up a strong bid on Nov. 1, 2017, on speculation that the imminent listing of bitcoin futures products on major US exchanges would open the floodgates for institutional money. Back then, BTC was trading above $6,000.
Notably, the “fear of missing out” (FOMO) established a self-feeding cycle of more investors joining the party, leading to an even bigger rise in price. By Dec. 17, BTC was trading at $20,000 and was seen rising to dizzy heights this year.
Such was the frenzy that Ari Paul, current CIO of Blocktower Capital, purchased 12-month call options with a strike price of $50,000 for $1 million. Call options give holders the right to buy the underlying cryptocurrency at an agreed price on or before a particular date.
Paul was essentially betting that BTC would rise to $50,000 by Dec. 28, 2018. The bubble, however, burst in the first quarter of this year and prices have been generally falling ever since. As a result, that now-worthless call option is set to expire next Friday.
A tough year
BTC’s slide from $20,000 to $3,200 could be categorized in the following phases:
Sell the fact: BTC closed last year at $13,880 – down 44 percent from the $20,000 high seen on Dec. 17 – possibly due to profit taking on long positions initiated in the run-up to the futures listings. Most experts called it a “sell the fact” scenario and dismissed it as nothing more than a healthy correction.
Bubble shrinks: The effects of regulatory clampdowns in China and South Korea weighed heavily over bitcoin’s price early in Q1. Both nations were the biggest sources of demand for cryptocurrencies before the restrictions. Prices subsequently fell to $6,000 on Feb. 6 and closed near $7,000 on Mar. 31.
Bear breather: BTC spent a better part of the second quarter and the entire third quarter defending the psychological level of $6,000. Notably, the key support level held ground in the third quarter, despite the decision by the US Securities and Exchange Commission’s (SEC) to reject BTC exchange-traded funds (ETFs). As a result, experts, including the likes of billionaire investor Novogratz, were convinced that BTC had bottomed out around $6,000.
Losses resume: BTC’s inability to produce a notable price bounce despite the repeated defense of $6,000 proved costly. Prices nosedived below the critical 21-month exponential moving average (EMA) support on Nov. 14, signaling a resumption of the sell-off from the record high of $20,000.
What lies ahead?
BTC hit a 15-month low of $3,122 over the weekend and is showing little signs of life below the 21-month EMA. The short-duration, technical charts, however, are signaling scope for a minor price bounce.
Monthly chart
The above chart shows BTC’s journey from the record highs a year ago to recent 15-month lows near $3,100. The outlook as per the monthly chart would turn bullish, if and when BTC crosses the former support-turned-resistance of the 21-month EMA, currently at $5,719.
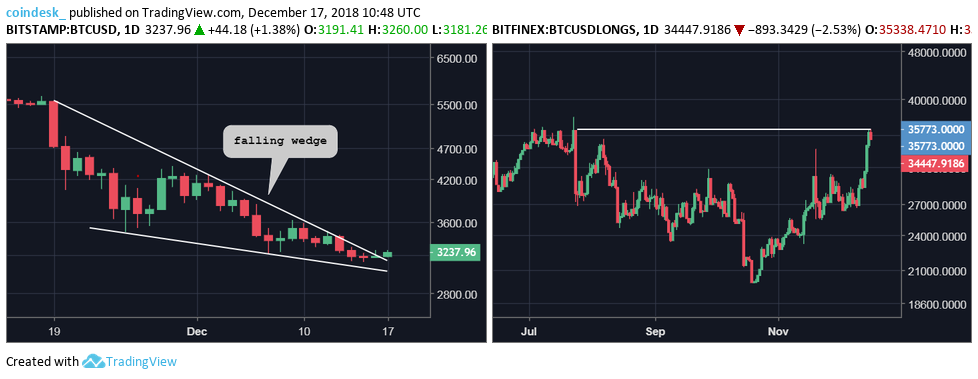
Daily chart and BTC/USD Longs on Bitfinex
BTC’s daily chart shows a “sideways” breach of the falling wedge resistance, meaning the breakout is not convincing. As a result, a more credible evidence of a bullish reversal is needed, possibly in the form a high-volume break above $3,633 (high of the 3-day inverted hammer candle).
That could yield a stronger corrective rally to levels above $4,000.
BTC/USD long positions on Bitfinex rose to 35,773 BTC earlier today – a level last seen on July 23. More importantly, the longs have risen by 33 percent in the last six days. That could be an indication that bargain hunters are paying heed to extreme oversold conditions reported by the 14-week relative strength index (RSI).
BTC, therefore, could witness a corrective bounce ahead of the year’s end.
View
- A drop to the psychological level of $3,000 remains on cards as long as BTC is trading below the crucial resistance at $3,633.
- A break above $3,633 would validate the falling wedge breakout seen in the daily chart and allow a rally to $4,000. A violation there would expose next resistance lined up at $4,410 (Nov. 29 high).
Disclosure: The author holds no cryptocurrency assets at the time of writing.
Bitcoin image via Shutterstock; charts by Trading View


