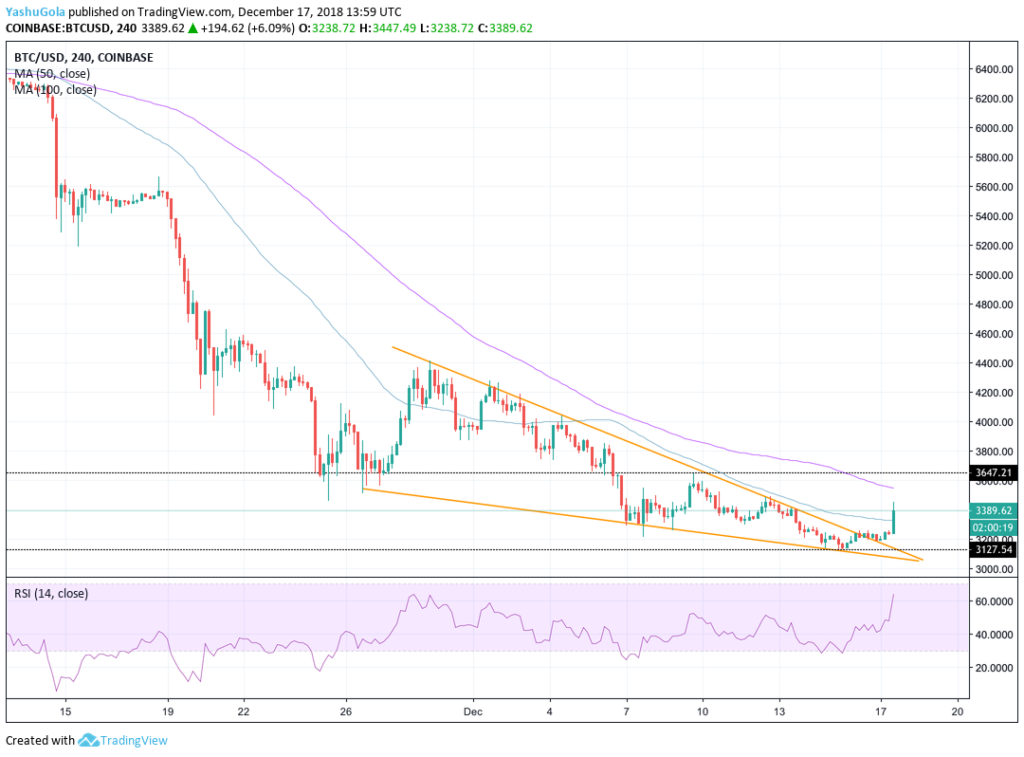
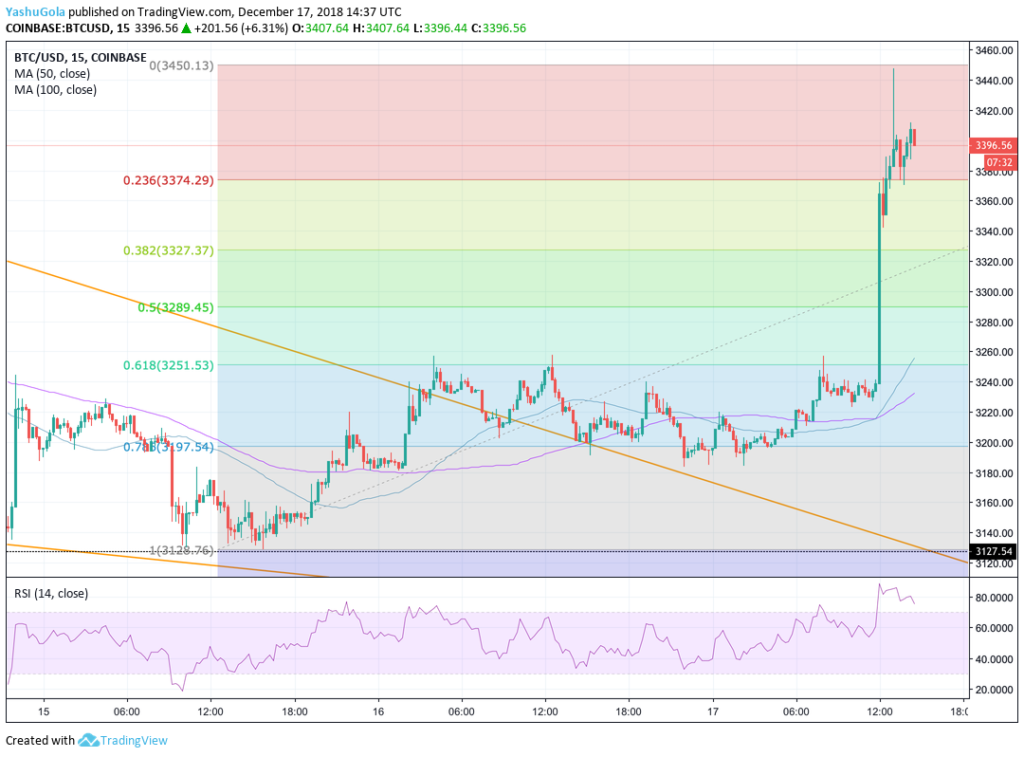
After setting one new low after another, the bitcoin-to-dollar rate on Monday underwent a sharp bullish correction to register a fresh high at 3450-fiat.
The upside action followed a low-volumed consolidation trend over the recent weekend trading session. The late night activity on Sunday, nevertheless, looked sharper and trade volume across the leading bitcoin pairs surged. It remained average as the Monday session came into play in Asia. The European hours, however, took the market by surprise by noting a sharp rise in bitcoin value, from 3238-fiat to 3450-fiat within just one hour.
The BTC/USD pair at press time is trading at 3389-fiat, up 8.3% from its yearly low.
BTC/USD Technical Indicators

The BTC/USD 4H Chart sourced from Coinbase is displaying bitcoin in a breakout scenario out of a falling wedge formation. In many of our previous analysis, we had noted the digital currency trending inside the said pattern which, according to its technical definition, results in a breakout action scenario that lasts as much as the height between the upper and lower trendline. As of now, this height spans an area worth $500.
Not expecting BTC/USD to stick to technical definitions, one can still look at the pair attempting to extend its bullish action, with the nearest resistance in sight at the 100-period moving average at 3546-fiat. As it reaches out further to the north, the RSI momentum indicator is also likely to push itself inside its overbought area. Then, the BTC/USD could see a corrective phase on the 4H timeframe.
A look at BTC/USD shorts could also bring more light to the future action. Whenever the volume of these shorts passes 40-42K, bulls trigger a short squeeze. The current rally coincides with 2.3% of the total shorts getting closed. If the percentage rises, expect bitcoin to extend its upside correction further.
BTC/USD Intraday Analysis

The range we are watching today has 3374-fiat serving as interim support and 3450-fiat serving as interim resistance. The field is pretty flexible owing to the randomness in price action.
We are beginning by opening a short position toward the interim support while maintaining a stop loss order 1-pip above the entry point. In case there is an extended selling action and price breaks below its support, then placing another short towards 3343-fiat – one-time support from today’s trading session – looks ideal, according to our breakdown strategy.
Looking to the upside, any sign of a green candle formation coupled with high volume will have us enter a long position towards 3450-fiat. At the same time, we will maintain our stop-loss order 1-pips below the entry point to support our overall risk management.
Click here for a real-time bitcoin price chart or here to review our latest crypto market coverage.
Featured Image from Shutterstock. Charts from TradingView.
Get Exclusive Crypto Analysis by Professional Traders and Investors on Hacked.com. Sign up now and get the first month for free. Click here.


