- Bitcoin saw some wild price action overnight that caused its price to spike as high as $19,600 before facing a rejection that sent it reeling down to $19,050
- It was able to find some serious support at this level that has boosted its price action in the time since, with it now trading just over $19,400
- This has long been a resistance level for the crypto, but the selling pressure previously found here appears to be rapidly degrading
- As such, BTC may be well-positioned to see further mid-term upside, with its last crucial resistance region existing between $19,600 and $20,000
- Once this region is firmly broken above, the crypto will likely see a parabolic trend higher
Bitcoin and the entire cryptocurrency market have provided investors with mixed signals, seeing multiple bouts of volatility that muddied the clarity regarding the market’s outlook.
Last week, BTC’s price plunged to lows of $17,600 before it found some strong support that allowed it to climb higher eventually.
Last night, it surged as high as $19,600 and formed what appeared to be a bullish breakout, but this once again resulted in the crypto facing some intense inflows of selling pressure that caused it to reel to $19,000.
Although it has since climbed higher, one analyst expects Bitcoin to see more of these “traps” in the near-term.
Bitcoin Gains Momentum Despite Overnight Rejection
At the time of writing, Bitcoin is trading up just under 1% at its current price of $19,400. This marks a notable surge from its daily lows of $19,050 set overnight, but it does mark a slight decline from highs of $19,600.
Where it trends next will likely depend largely on whether or not it faces another rejection at the resistance that exists just above its current price level.
Here’s When BTC Will Stop Seeing “Traps”
Bitcoin has seen multiple bull and bear traps as of late, which has made it increasingly unclear as to where the cryptocurrency might trend next.
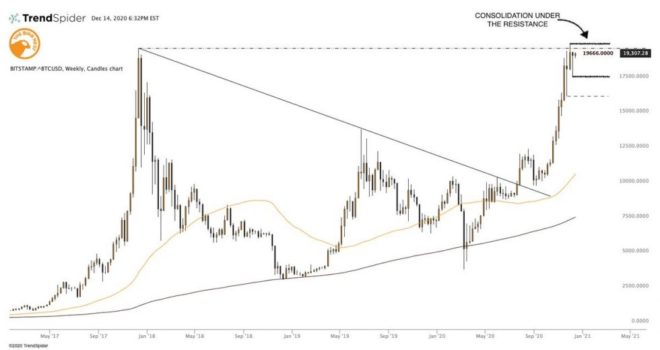
One trader believes that these fake-out movements will continue occurring until the crypto posts a weekly candle close above its $19,700 resistance.
“It’s consolidation under the resistance pattern for $BTC – can be evaluated easily based on medium-term averages, which recently have lost on momentum. For massive upside continuation, it just needs one weekly candle to close through the resistance. Until then, lots of traps.”
Image Courtesy of CryptoBirb.
Until this weekly candle close occurs, it won’t be easy to trust any decisive upwards movements seen by Bitcoin.
Featured image from Unsplash.
Charts from TradingView.


