Total crypto market cap erased $52.4 billion from its value for the period since Monday morning and now stands at $938 billion. The top ten coins are mostly in red for the last 24 hours with PolkaDot (DOT) and Cardano (ADA) registering an 8.9 and 1.4 percent increase respectively while Bitcoin Cash (BCH) lost 5.6 percent. At the time of writing bitcoin (BTC) is trading at $31,700 on the Bitstamp daily chart, ether (ETH) dropped to $1,210. Ripple’s XRP is hovering around $0.278.
BTC/USD
Bitcoin closed the trading day on Sunday, January 17 at $35,779. It was the third straight day in red for the leading cryptocurrency after it was rejected at $40,000 on January 14.
Not only that, but it was trading as low as $33,741 at some point during the intraday session, touching the lower limit of the symmetrical triangle formation on the daily chart. BTC ended the week with 6.4 lower compared to the previous seven-day period.
On Monday, the BTC/USD pair once again hit the $34,800 horizontal support and fell below the 100-day EMA on the 4-hour timeframe before rebounding in the afternoon forming a green candle to $36,600.
Bulls continued to push the price upwards and on the second day of the week reached $37,700 for the second time in the last three days. This zone was also in line with the 61.80% Fibonacci retracement level on the lower timeframes. Bitcoin faced a solid resistance there and retraced down to $35,900, moving below all short-term EMAs.
The mentioned triangle figure was broken down in the morning of Wednesday, January 20, which caused a widespread selloff in the markets. The coin retraced to $33,372 before finding stability near 34,200 and eventually closing at $35,500.
Both the Volume Zone Oscillator and Relative Strength Index indicators entered the oversold area.
The bear pressure increased dramatically on Thursday, driving the price of BTC to the next major support on the daily timeframe – $32,000. The coin could not stabilize and reached the $36,200 area where all major short-term EMAs were situated on the 4-hour chart.
As of the time of writing, BTC is hovering around $31,700.
ETH/USD
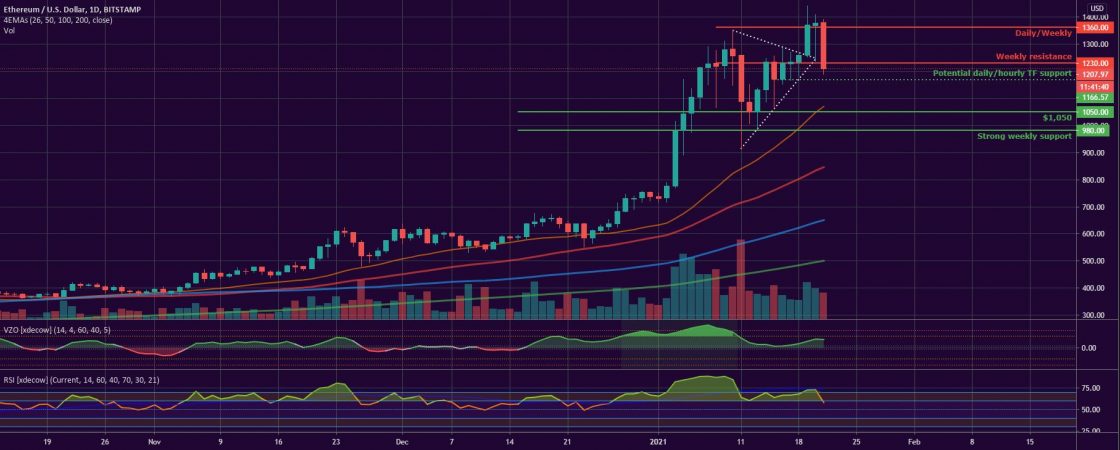
The Ethereum Project token ETH hit the solid horizontal resistance at $1,230 on Sunday, January 17, and ended the week with a 2.3 percent decrease in price. The daily chart was looking more and more bullish especially after the ether successfully consolidated near $1,050 on January 12. Now it was ready to form another leg up in a search of its new all-time high.
The ETH/USD pair surpassed the mentioned weekly resistance on Monday reaching $1,257. Nonetheless, it was caught in a triangle pattern very similar to the one we discussed for BTC. Unlike the biggest coin, ether managed to break out of it and skyrocketed to the next major daily/weekly resistance at $1,370 on Tuesday, January 19. What’s more, it hit $1,440 during the day session thus registering a new all-time high.
The mid-week session on Wednesday was a wild one for the ETH token as it fell to $1,230 during the sudden market crash before recovering to $1,377 in the evening.
On Thursday, January 21, the coin followed the example of the rest of the major altcoins and initiated a correction. It pulled back to the same old weekly support/resistance at $1,230, deleting 10.6 percent in the span of just a few hours.
As of the time of writing, ETH is trading at $1,210.
Like BTCMANAGER? Send us a tip!
Our Bitcoin Address: 3AbQrAyRsdM5NX5BQh8qWYePEpGjCYLCy4


